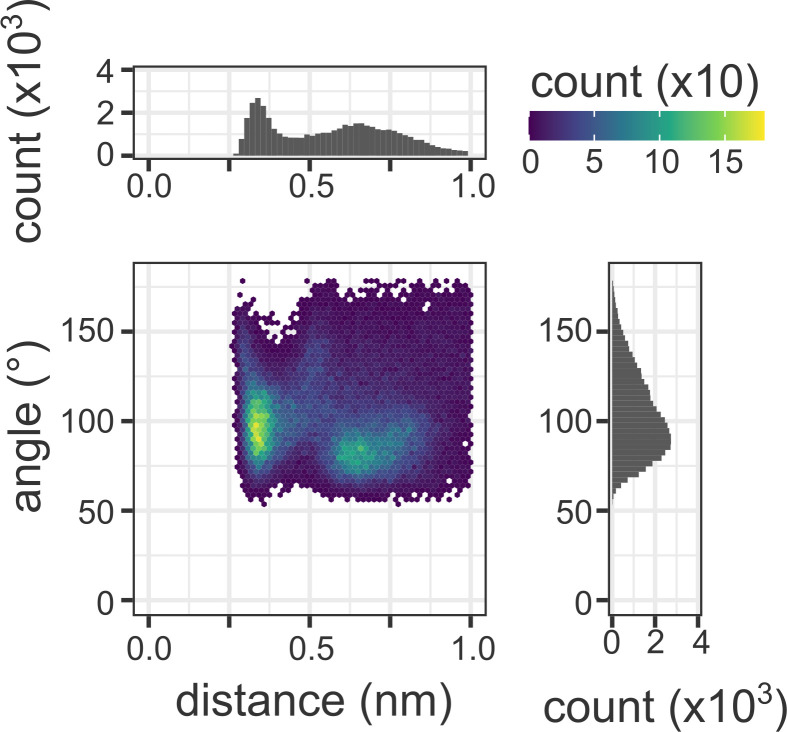
Fig 6.
Interaction between S211 and the N8 atom of ceftazidime. 2D histogram for the distribution of the distance and angle between the Oγ atom of S211 and the N8 atom of ceftazidime. “Distance” axis indicates the distance between the Oγ atom of S211 and the N8 atom of ceftazidime. “Angle” axis indicates the angle between the atoms of Oγ and HG of S211 and the N8 atom of ceftazidime. Each point represents a snapshot from the molecular dynamics simulations, colored according to its counts shown in the color bar on the top right corner.

