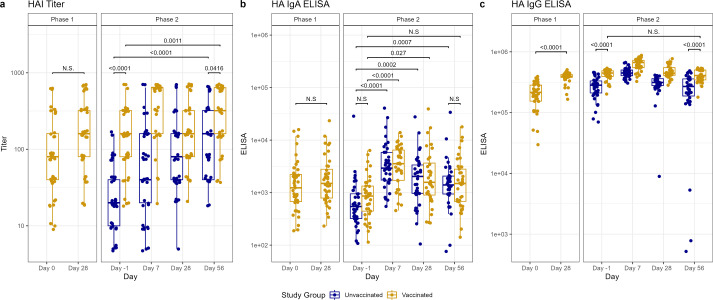
Fig 2.
Antibody titers after vaccination (phase 1) and H1N1 viral challenge (phase 2) as tested by HA inhibition (HAI) assays (A), ELISA for nasal anti-HA IgA (B), and ELISA for serum anti-HA IgG (C). In phase 1, day 0 represents baseline titers on the day of vaccination. Subsequently, in phase 2, day −1 represents baseline titers prior to viral challenge on day 0. Individual values represented by dots for unvaccinated participants in blue and vaccinated participants in yellow. Horizontal lines represent medians and first and third quartiles. Vertical lines represent minimum and maximum non-outliers. P-values from Wilcoxon rank sum tests, adjusted for multiple comparisons by Holm’s method, comparing unvaccinated and vaccinated participants shown, with P < 0.05 considered statistically significant. Important non-significant (N.S.) comparisons also shown.

