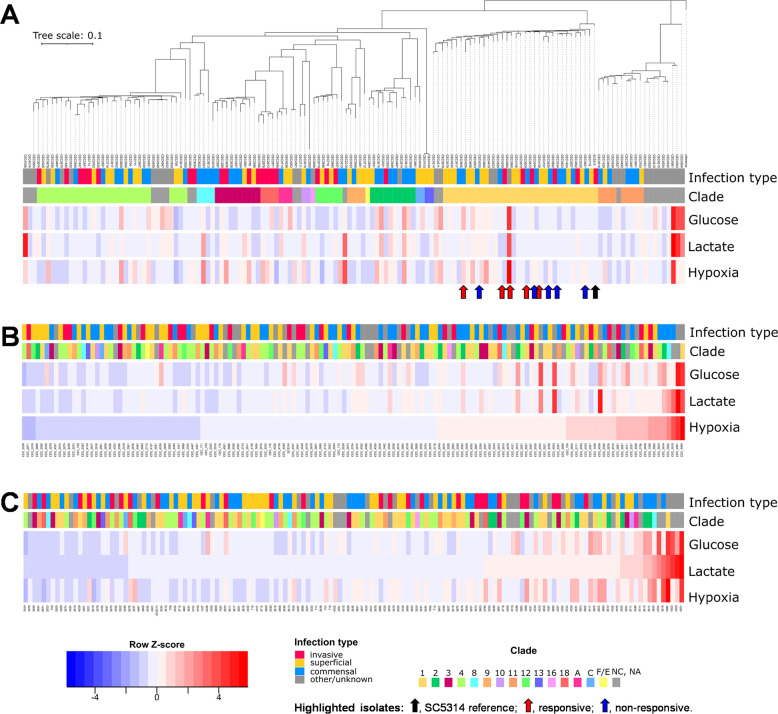
Fig 1.
C. albicans clinical isolates display variability with respect to their β-1,3-glucan masking phenotypes. The β-1,3-glucan exposure levels for 146 C. albicans clinical isolates were quantified by Fc-dectin-1 staining and flow cytometry under control conditions (glucose, GYNB) and following exposure to lactate or hypoxia. Row Z-scores were calculated based on the mean fluorescence intensities of three biological replicates per condition and visualized in heatmaps: blue, strong β-1,3-glucan masking; white, no significant masking; red, β-1,3-glucan exposure. The cluster to which each clinical isolate belongs is indicated by the color code: NC, no cluster assigned. Also, the nature of the infection from which each isolate was obtained is color coded (see key). The reference C. albicans isolate (SC5314, black arrow), the five responsive isolates (CEC3560, CEC3605, CEC3609, CEC4108, CEC4259; red arrows), and five non-responsive isolates selected for further analysis (CEC3534, CEC3544, CEC3621, CEC3636, CEC4035; blue arrows) are highlighted. (A) The clinical isolates are clustered with respect to their sequence relatedness. All responsive and non-responsive isolates are from cluster 1. (B) The isolates are re-ordered with respect to the strength of their hypoxia-induced β-1,3-glucan masking (MFI hypoxia/MFI glucose control = normoxia). (C) The isolates are re-ordered with respect to the strength of their lactate-induced β-1,3-glucan masking (MFI glucose plus with lactate/MFI glucose control).

