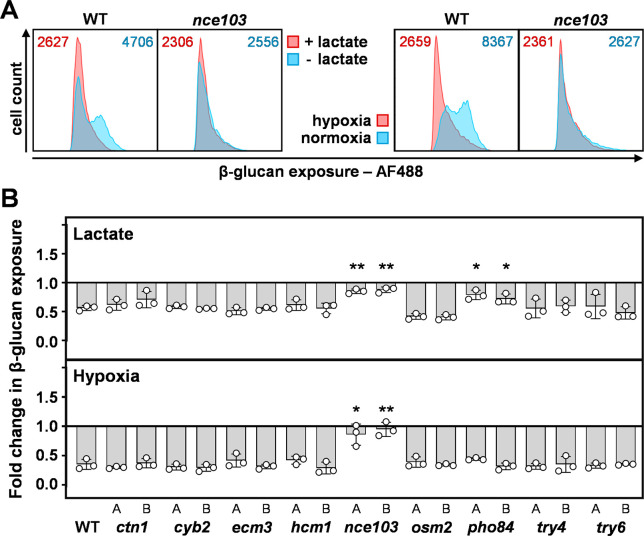
Fig 4.
Impact of the target loci upon lactate- and hypoxia-induced β-1,3-glucan masking in C. albicans. Each target locus was deleted in C. albicans SC5134 (WT), and the degree of β-1,3-glucan masking quantified each mutant in response to lactate and hypoxia via Fc-dectin-1 staining and flow cytometry. (A) Representative cytometry plots from three independent experiments showing the β-1,3-glucan exposure for nce103 cells and their wild type control (SC5134). The left-hand panels show responses to lactate, and the right-hand panels show the responses to hypoxia: blue, control, no masking stimulus; pink, plus masking stimulus. The corresponding MFIs are shown at the top of each panel. (B) Two independent homozygous null mutants (A, B) were analyzed for each target gene. Fold changes in β-1,3-glucan exposure were calculated by dividing the MFI for lactate- or hypoxia-exposed cells by the MFI for the corresponding normoxic GYNB control (Materials and Methods). Means and standard deviations from three independent replicate experiments are shown, and the data were analyzed using ANOVA with Tukey’s multiple comparison test: *, P < 0.05; **, P < 0.01.

