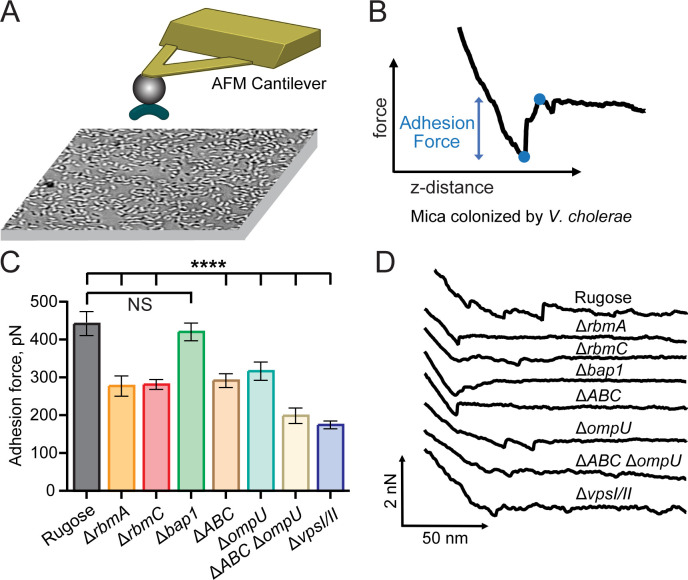
Fig 5.
Matrix proteins, OmpU, and VPS contribute to overall adhesion forces of cells in biofilms. (A) Cartoon representation of the single cell force spectroscopy experiment. V. cholerae cells were attached to a 5 µm bead to obtain surface adhesion measurements from force-distance curves. The surface was colonized with V. cholerae cells prior to measurements resulting in mixed cell-cell and cell-surface contributions to the measured adhesion forces. (B) Example force-distance curve. The blue points on the curve indicate the minimum and maximum force at the adhesion event. The difference in force between these points is the adhesion force. (C) Average adhesion force for the indicated V. cholerae strains. Error bars represent standard error of the mean. Asterisks indicate the results of student’s t-test relative to the rugose parent strain (****P < 0.00001, NS, not significant). (D) Representative force curves for each of the indicated V. cholerae strains.

