Fig 3.
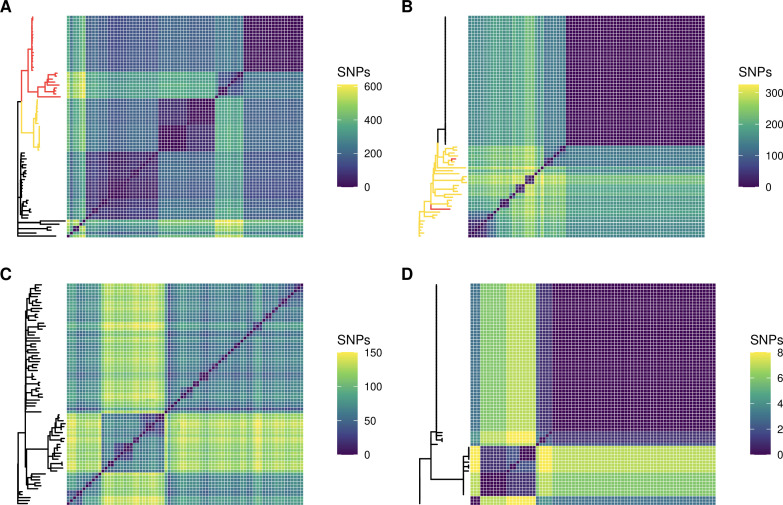
Genomic diversity as measured by core genome SNPs varies greatly from one population to another. Populations are presented in order of decreasing genomic diversity: Patient 1 (A), Patient 2 (B), Patient 3 (C), and Patient 4 (D). Each matrix represents the pairwise comparison of SNPs across all 75 isolates within a population against each other, and each population is composed of a single strain type. Isolates with one DNA mismatch repair mutation are highlighted in yellow on phylogenies. Isolates with two DNA mismatch repair mutations are highlighted in red.

