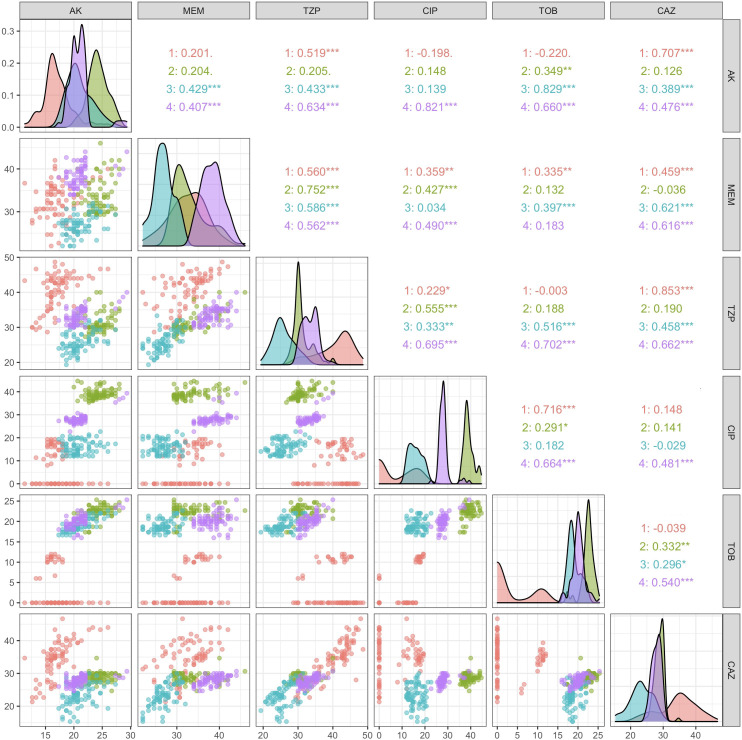
Fig 6.
Lack of statistically significant negative correlations between any two antimicrobial susceptibility profiles in a Pearson’s correlation provides no evidence for collateral sensitivity trade-offs. Pearson’s correlation coefficient (upper right quadrant), scatterplots (lower left quadrant), and density plots (diagonal) for pairwise comparisons of susceptibility profiles across all six tested antimicrobials: AK, MEM, TZP, CIP, TOB, and CAZ.

