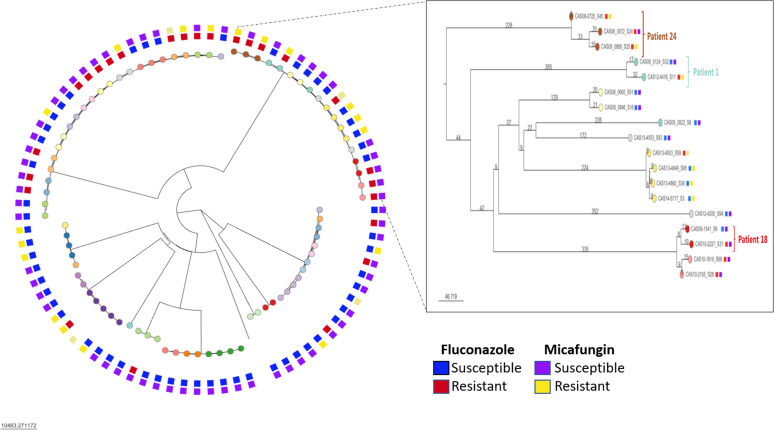
Fig 2.
Neighbor-joining phylogeny of C. glabrata. The final data set included a total of 243,415 nucleotides for 82 isolates. Each leaf node color represents a patient, and the external squares indicate susceptible/resistant phenotype. Box: zoom in shows examples of patients with isolates that acquired resistance to echinocandins (Patient 24), azoles (Patient 18), or both (Patient 1). Branch length indicates the number of SNPs.

