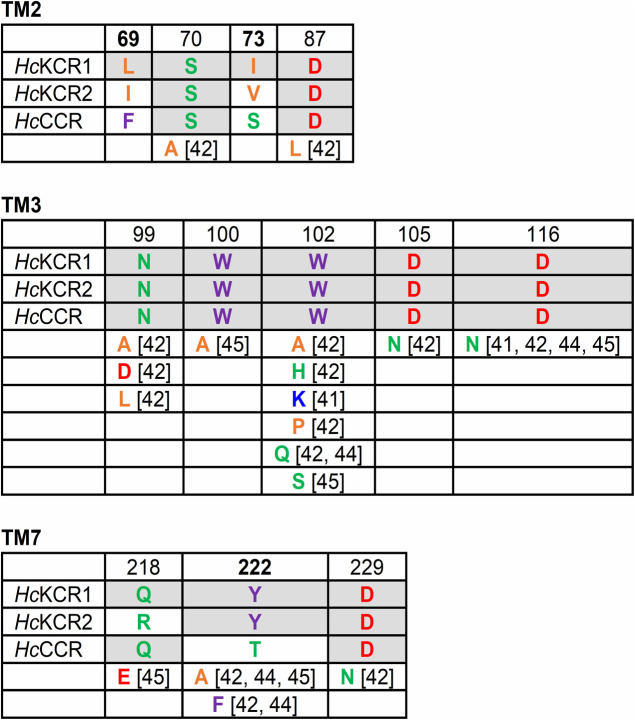
Figure 3 .
The residues in TM2, TM3 and TM7 that determine K+ selectivity of KCRs, as demonstrated by mutation analysis. The lower rows show the substitutions of the residues conserved in HcKCR1 and HcCCR that nevertheless led to a decrease in K+ selectivity in the former. The color code is as in Fig. 1. For more detailed explanation see the text.

