

SUMMARY
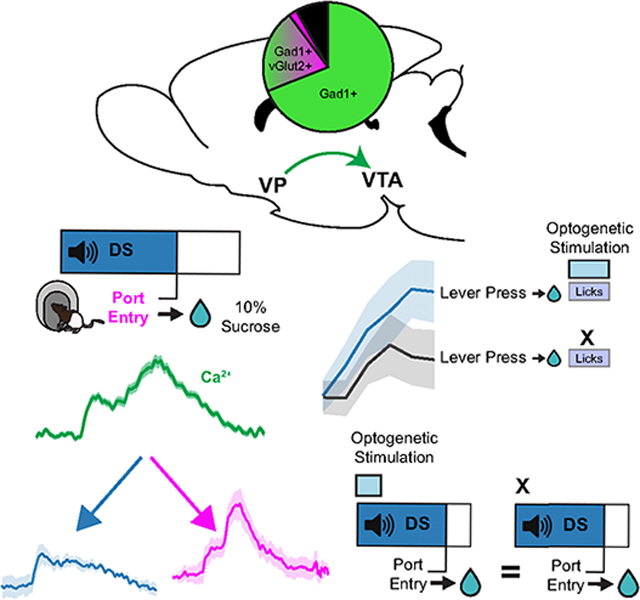
Reward-predictive cues acquire motivating and reinforcing properties that contribute to the escalation and relapse of drug use in addiction. The ventral pallidum (VP) and ventral tegmental area (VTA) are two key nodes in brain reward circuitry implicated in addiction and cue-driven behavior. In the current study, we use in vivo fiber photometry and optogenetics to record from and manipulate VP→VTA in rats performing a discriminative stimulus task to determine the role these neurons play in invigoration and reinforcement by reward cues. We find that VP→VTA neurons are active during reward consumption and that optogenetic stimulation of these neurons biases choice behavior and is reinforcing. Critically, we find no encoding of reward-seeking vigor, and optogenetic stimulation does not enhance the probability or vigor of reward seeking in response to cues. Our results suggest that VP→VTA activity is more important for reinforcement than for invigoration of reward seeking by cues.
In brief
Palmer et al. show that ventral pallidum neurons projecting to the ventral tegmental area do not encode or drive cue-elicited reward seeking but can drive reinforcement and alter choice behavior in response to rewards themselves. This suggests that these neurons are more involved in reinforcement than in motivation or invigoration.
Graphical Abstract:
INTRODUCTION
Animals use sensory cues associated with threats and rewards to make predictions and inform decision-making. In addition to their predictive utility, reward-predictive cues can acquire incentive motivational value, which enables them to capture attention, enhance desire, and powerfully bias animal behavior in favor of reward pursuit and consumption.1 While evolutionarily advantageous in naturalistic settings, incentive motivational processes contribute to maladaptive reward seeking and consumption characteristic of addiction.2,3 Characterizing the neurobiological mechanisms by which reward-predictive cues motivate and reinforce seeking behavior is therefore critical.
The ventral pallidum (VP) is a basal forebrain nucleus crucial in the performance of cue-driven behavior.4–6 Recent circuit-specific manipulations have identified functionally divergent roles of VP neurons based on their projection targets.7–11 VP neurons projecting to the ventral tegmental area (VTA) appear specifically to promote cue-driven behavior, including cue-induced reinstatement of cocaine seeking12,13 and context-induced reinstatement of alcohol seeking.14 However, the underlying neurobiological and psychological mechanisms by which these neurons mediate cue-elicited reward seeking are unknown. Prior extracellular recordings identified VP neurons that respond to discriminative cues and predict the vigor of animals’ reward seeking.15–17 Parallel work has demonstrated that VTA dopaminergic signaling promotes effortful responding to discriminative cues.18,19 In addition to vigor-encoding neurons, VP contains single units that encode reward-prediction error signals20,21 resembling those canonically associated with VTA dopamine signaling and reinforcement learning.22–24 Thus, evidence exists suggesting that VP and VTA support both cue-elicited invigoration and/or reinforcement.
While VP and VTA are both crucial nodes in reward circuitry implicated in addiction, the specific role of VP neurons projecting to the VTA (VP→VTA) is poorly defined. Prior literature probing these neurons during cue-elicited behavior has largely focused on their contribution to cue-induced reinstatement of drug seeking, in which Pavlovian cues are presented in response to the action previously associated with drug delivery. The translational relevance of such paradigms has been debated in part because those who suffer from addiction often passively encounter cues outside of their control, including discriminative cues signaling reward availability.25–27 In the current study, we used in vivo fiber photometry and optogenetics to record from and manipulate VP→VTA neurons in rats performing a discriminative stimulus (DS) task15,16,28 with sucrose reward to determine the fundamental roles these neurons play in invigoration and reinforcement by reward and associated discriminative cues. For optogenetic manipulations, we compared manipulation of VP→VTA to manipulation of neurons projecting to another major output of the VP: the mediodorsal thalamus (VP→mdThal).5,6,29,30 Prior work indicates that they are largely separate populations with potentially distinct psychological functions.31
RESULTS
Rats learn to discriminate between the DS and neutral stimulus (NS)
To target VP→VTA neurons, we used an intersectional viral approach (Figures 1A and 1D). To determine whether this approach predominantly targeted GABAergic or glutamatergic VP neurons, we used RNAscope in situ hybridization with probes for Gad1, Slc17a6 (VGlut2), and mCherry in rats that received a retrograde virus for Cre-recombinase in the VTA and Cre-dependent mCherry in VP (Figures 1A–1C). We found that 92.9% ± 4.0% of mCherry-positive neurons were Gad1 positive, including 23.8% ± 4.2% that were positive for both Gad1 and VGlut2. Only 1.4% ± 0.9% of neurons were positive for VGlut2 only (Figure 1C). Thus, while the majority of VP→VTA cells that we targeted were likely GABAergic, a substantial number had both GABAergic and glutamatergic markers.
Figure 1. Viral approach and DS task.
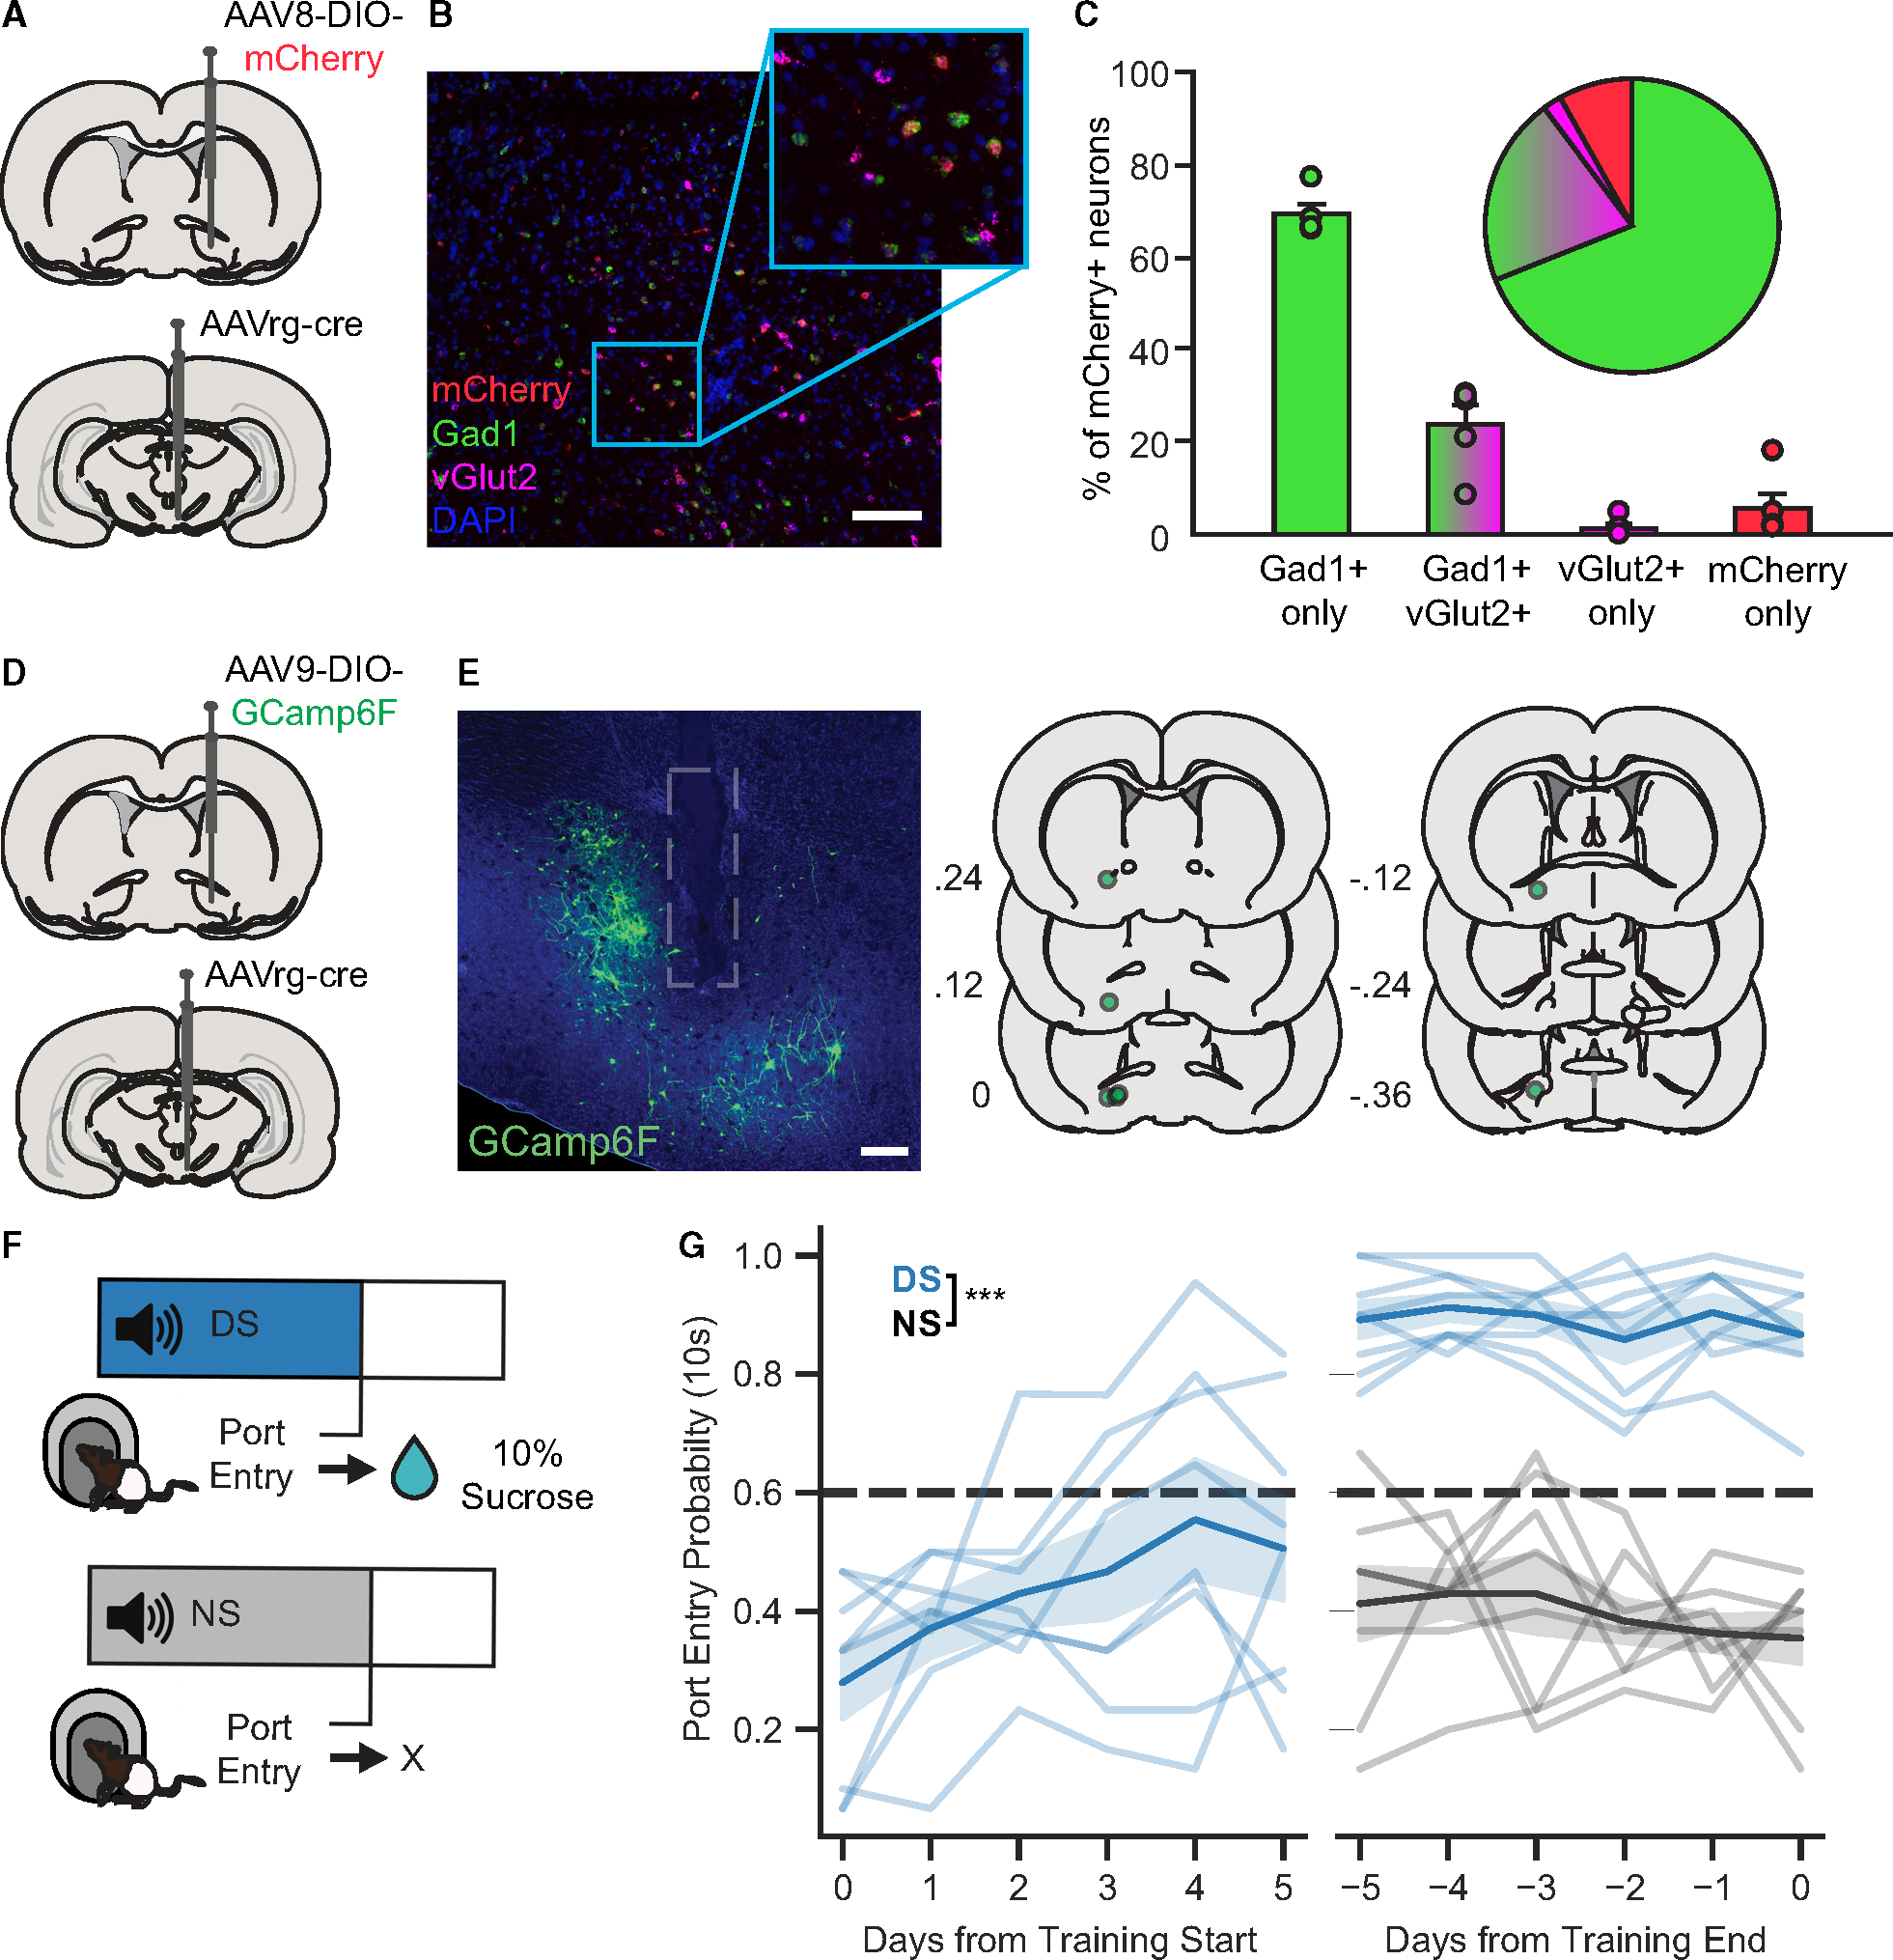
(A) Intersectional viral approach used for RNAscope in situ hybridization assessment of neurochemical identity.
(B) Representative image of VP tissue processed with RNAscope with markers for mCherry (red), Gad1 (green), and VGlut2 (pink). DAPI is in blue. Scale barrepresents 100 μm.
(C) Quantification of the percent of mCherry+ cells expressing Gad1, VGlut2, or both cell-type-specific markers. Bars graphs show between-subject mean ± SEM; circles represent individual rats (n = 5 rats). Pie chart shows the proportion of each cell type across all mCherry+ neurons (822 total; 567 Gad1+ only, 17 VGlut2+ only, 171 Gad1+ VGlut2).
(D) Intersectional viral approach used for projection-specific GCaMP6f recordings from VP→VTA neurons.
(E) Representative image of GCaMP6f expression (green) and optic fiber tract (gray outline) in the VP. Scale bar represents 100 μm.
(F) DS task design, with 10% sucrose reward delivery contingent on rats’ port entry during DS presentation.
(G) Probability of port entry within 10 s of cue onset (blue = DS, gray = NS) in the first 5 and final 5 training sessions (***, main effect of cue, F(1, 77) = 534.297,p < 0.001). Horizontal dashed line (black) indicates performance criteria for DS port entry probability (0.6). Lines with shading indicate between-subject mean ± SEM (n = 8 rats).
To record calcium activity from VP→VTA neurons during the performance of cue-elicited reward seeking, a genetically encoded calcium indicator, GCaMP6f, was expressed using our intersectional viral approach (Figure 1D), and optical fibers were implanted in VP (Figure 1E). Rats were trained to perform a DS task. In the DS task, presentation of an auditory reward-predictive DS signaled availability of 10% sucrose contingent on rats’ port entry, while the NS was not associated with reward availability (Figure 1F). Thus, the NS serves as a control for nonspecific effects of acute auditory cue presentations. To promote rapid and selective responding to the DS, rats were first trained with the DS alone, which was presented initially for 60 s, and then shortened to 30, 20, and finally 10 s, once rats met performance criteria (responding to at least 60% of DS cues) at each cue duration. Once rats responded at least 60% of the time to a 10-s DS cue, the NS was introduced. Rats took between 8 and 29 sessions to reach performance criteria for NS introduction (Figure S1; mean = 13.375, SEM = 2.535). To assess DS task performance, we calculated the probability and latency to enter the port within 10 s following cue onset for each session as previously described.15,28 As expected, we found that the probability of port entry within 10 s of DS onset, but not NS onset, increases across essions (Figure 1G). Rats took between 9 and 38 sessions to meet criteria for discriminating between DS and NS cues (responding to 60% of DS cues and no more than 40% of NS cues; mean = 17.375, SEM = 3.184). Once rats met criteria for DS versus NS discrimination, a 1-s reward delivery delay was added between port entry and sucrose delivery to better dissociate photometry signals related to reward anticipation and consumption.
Rats continued training sessions with a 1-s reward delay added for up to 6 days, reaching a maximum of 45 recording sessions (27.625 ± 2.809 SEM). In these final sessions, rats consistently responded more often to the DS than to the NS (main effect of cue, F(1, 77) = 534.297, p < 0.01). In addition, rats made port entries more quickly following DS presentations compared to NS presentations (port entry latency, main effect of cue, F(1, 1,857.9) = 196.235, p < 0.001).
VP→VTA neurons are selectively active on DS trials, contingent on port entry
To determine if VP→VTA calcium activity exhibited reward-related changes, we first compared the GCaMP signal between DS and NS trials (Figure 2A). We examined a subset of four specific sessions for each subject: the first day of training with the DS alone, the day the NS was introduced, the day each rat met behavioral criteria for DS versus NS discrimination, and the final session after a 1-s delay was introduced between DS port entries and reward delivery. To quantitatively compare the magnitude of GCaMP responses, we computed peri-cue areas under the curve (AUCs) of the GCaMP signal during the 10 s following cue onset (Figure 2B). As expected, we observed that VP→VTA calcium activity was significantly elevated on DS trials compared to NS trials across training (main effect of cue, F(1, 1,427) = 122.858, p < 0.001). DS AUCs were significantly different from zero in each session (DS vs. zero; first session, t(6) = 2.48, p = 0.048; NS introduced, t(14.6) = 5.397, p < 0.001; criteria met, t(14.6) = 7.447, p < 0.001; final session, t(14.6) = 9.908, p < 0.001), while the NS AUCs were only significantly different from zero in the first session the NS was present (NS vs. zero; NS introduced, t(14.6) = 2.699, p = 0.050; criteria met, t(14.6) = 2.199, p = 0.127; final session, t(14.6) = 1.356, p = 0.480). The magnitude of the peri-cue GCaMP AUC increased across training for DS trials but not NS trials (interaction of cue type and session, F(2, 1,635.9) = 11.193, p < 0.001). These data suggest that VP→VTA is selectively active following reward cue presentation and does not respond to neutral cues.
Figure 2. Calcium dynamics of VP→VTA during DS task performance.
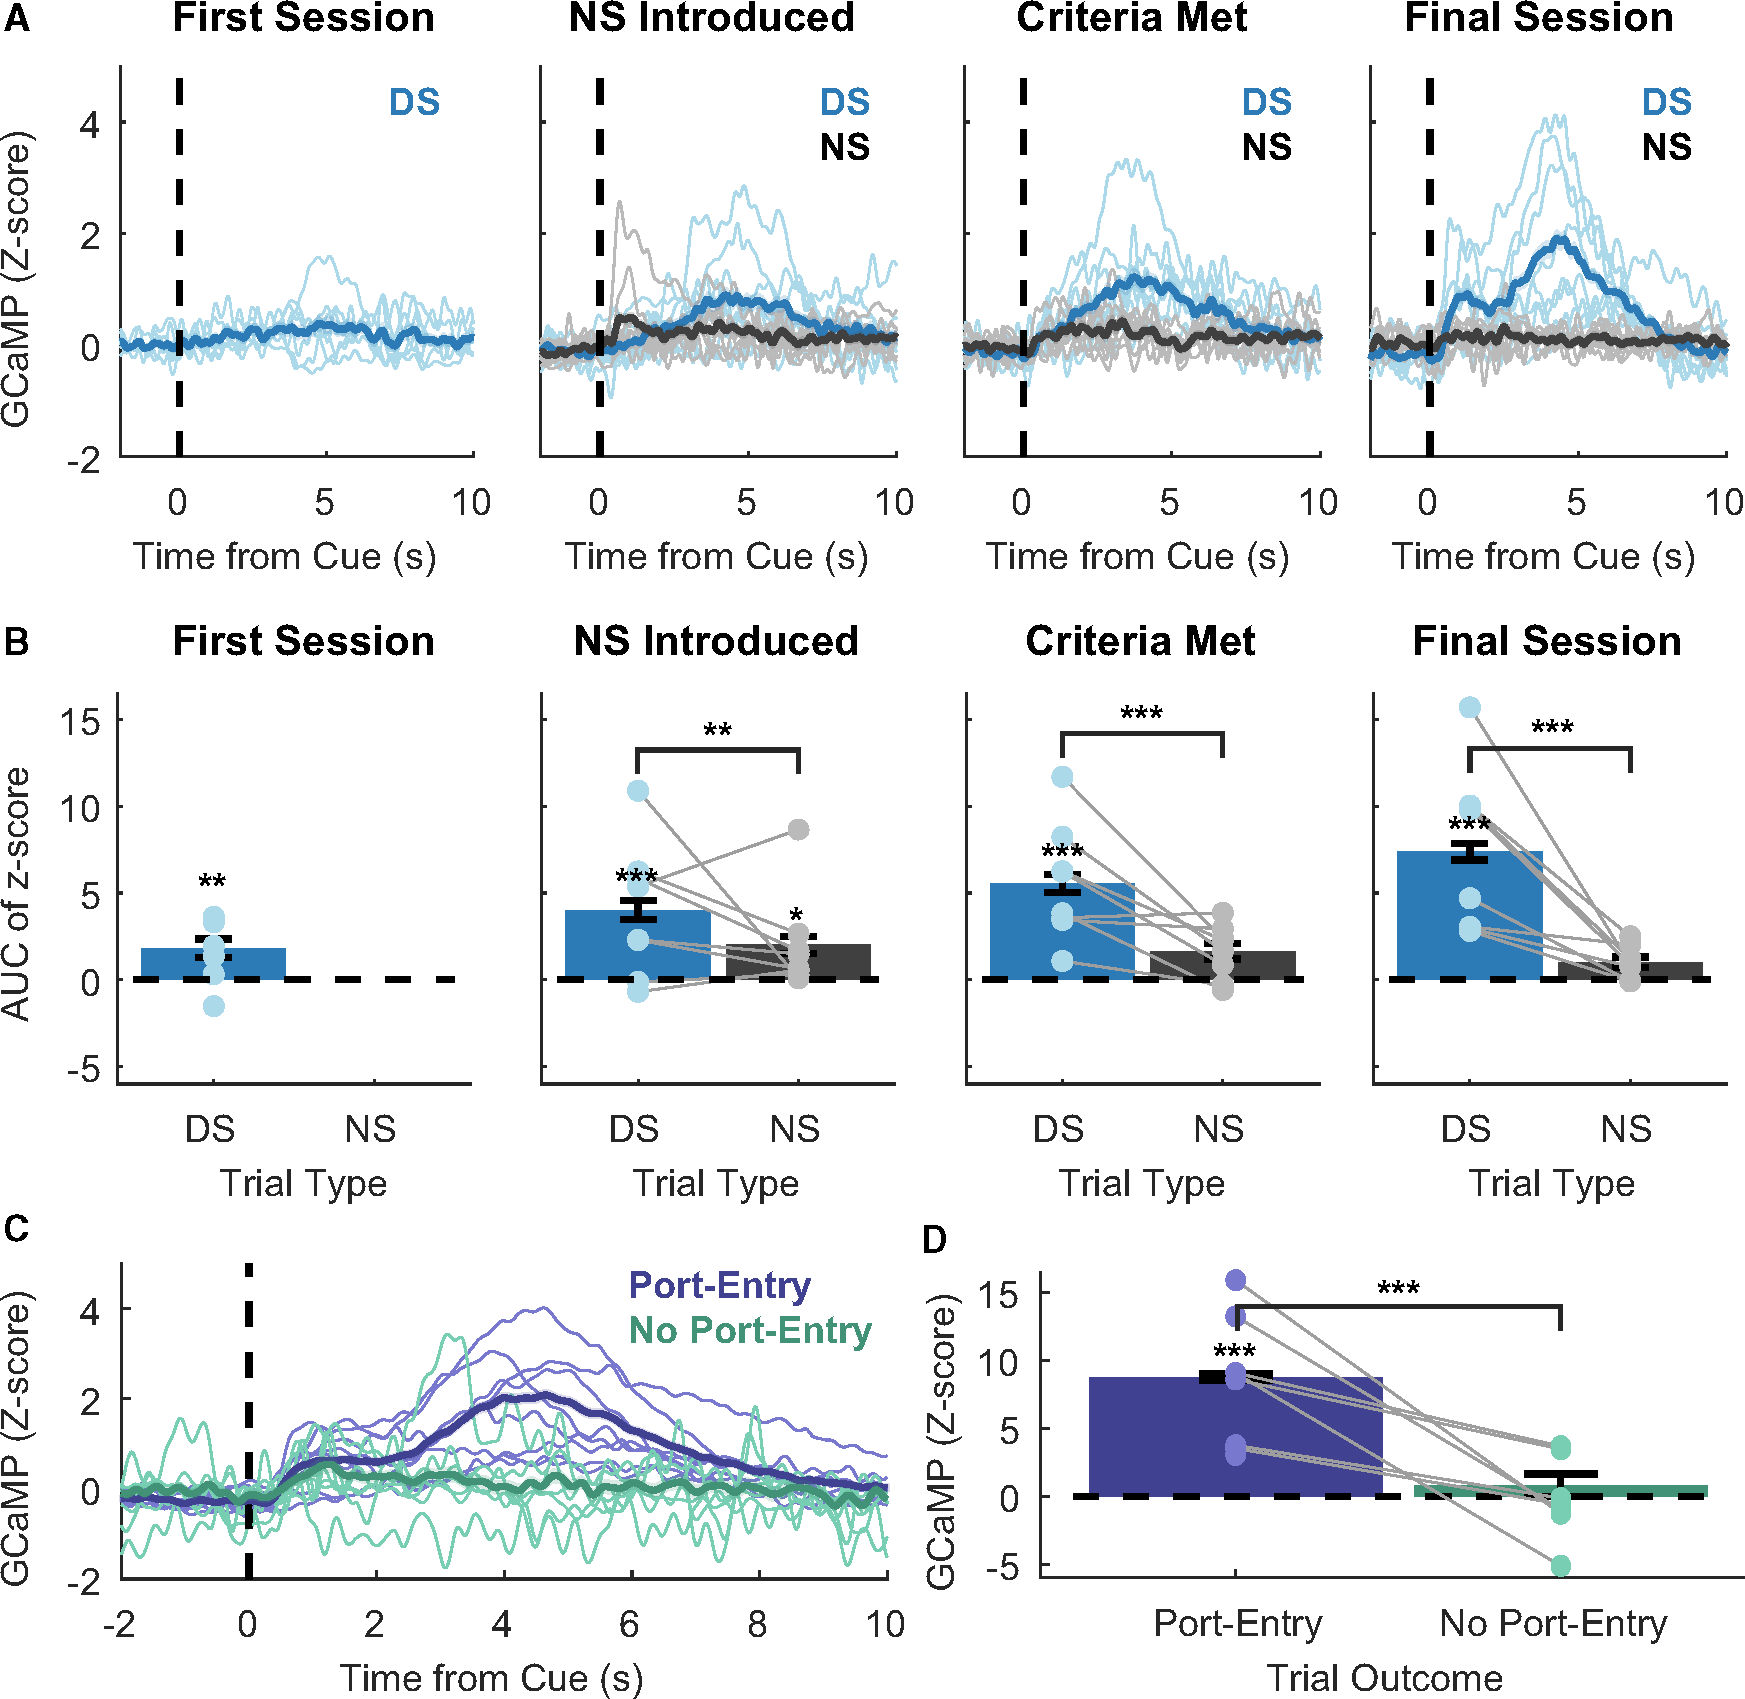
(A) Peri-cue calcium traces (blue = DS, gray = NS) on the first training session, the day NS was introduced, the day task performance criteria were met, and the final training session. Lines with shading indicate between-subject mean ± SEM (n = 8 rats). Individual points and lines without shading indicate individual subject means.
(B) AUC of peri-cue calcium traces on the first training session, the day NS was introduced, the day task performance criteria were met, and the final training session after the introduction of a delay between DS port entry and reward delivery (main effect of cue (F(1, 1,427) = 122.858, p < 0.001; DS vs. zero; first session, t(6) = 2.48, p = 0.048; **, NS introduced, t(14.6) = 5.397, p < 0.001; ***, criteria met, t(14.6) = 7.447, p < 0.001; ***, final session, t(14.6) = 9.908, p < 0.001; NS vs. zero; NS introduced, t(14.6) = 2.699, p = 0.050).
(C) Mean peri-DS calcium traces by behavioral outcome during the final session with a 1-s delay between port entry and reward delivery (purple = port entry during DS, teal = no port entry during DS).
(D) Mean AUC peri-DS calcium traces by behavioral outcome (main effect of port entry outcome F(1, 1,279.5) = 51.047, p < 0.001; ***, DS with port entry vs. zero, t(7.02) = 5.217, p = 0.002).
To examine whether VP→VTA activity was reflective of DS presentation alone or associated with subsequent reward-seeking behavior, we compared peri-DS GCaMP traces from trials with a port entry outcome to those from trials without a port entry. Interestingly, significant peri-DS VP→VTA calcium activation was present only on DS trials in which the animals entered the port (Figure 2D; DS with port entry versus DS with no port entry, F(1, 1,279.5) = 51.047, p < 0.001; DS with port entry versus zero, t(7.02) = 5.217, p = 0.002; DS with no port entry versus zero, t(11.92) = 0.834, p = 0.664). These data suggest that peri-DS VP→VTA activation may not be elicited by the DS cue itself but may be associated with subsequent pursuit and/or consumption of reward. Alternatively, the cue itself may evoke a stronger response on trials when the animal is more motivated to respond, as has been previously reported in VP.15,16 Therefore, our subsequent analyses aimed to examine more precisely the temporal associations between the discrete task events (cue versus port entry) and the GCaMP signal.
Population-level VP→VTA calcium activity is dynamic and peaks during reward consumption
To examine the temporal relationship between the GCaMP photometry signal and behavioral task events, we examined peri-event traces time-locked to distinct events from sessions in which there was a delay between DS port entry and reward delivery (DS onset, first port entry following DS; Figure 3A; Figure S2). Qualitatively, two peaks were apparent in the peri-DS traces: the first with an initial rise in signal starting from +0.3 s to a peak centered around +1.0 s, followed by the second with a greater rise starting from +2.5 s to a peak centered around +4.0 s. In the traces time-locked to port entry, these two peaks were also present but were greater in magnitude and are shifted earlier in time relative to peri-DS traces, revealing a temporal dependence on port entry. Interestingly, when time-locked to port entry, the initial ramp in GCaMP signal appeared to begin prior to port entry. To better examine the calcium activity in response to DS versus port entry in the context of trial-to-trial variability in response latency, we made peri-event heat plots for individual trials, time-locked to the DS versus port entry and sorted based on the latency between task events for each trial (Figure 3B, representative subject). Peri-event heat plots revealed that the second increase in VP→VTA GCaMP fluorescence consistently occurs after port entry, shifting later in time as response latency grows longer, peaking during sucrose consumption (post lick; Figure S2). These heat plots revealed variable dynamics in the epoch between cue onset and port entry, which may reflect responses to cue presentation and/or signals related to reward pursuit. Therefore, we proceeded with a linear encoding model analysis to statistically evaluate the relationship between event timing and calcium activity.32,33
Figure 3. Temporal relationship between DS trial events and VP→VTA calcium activity.
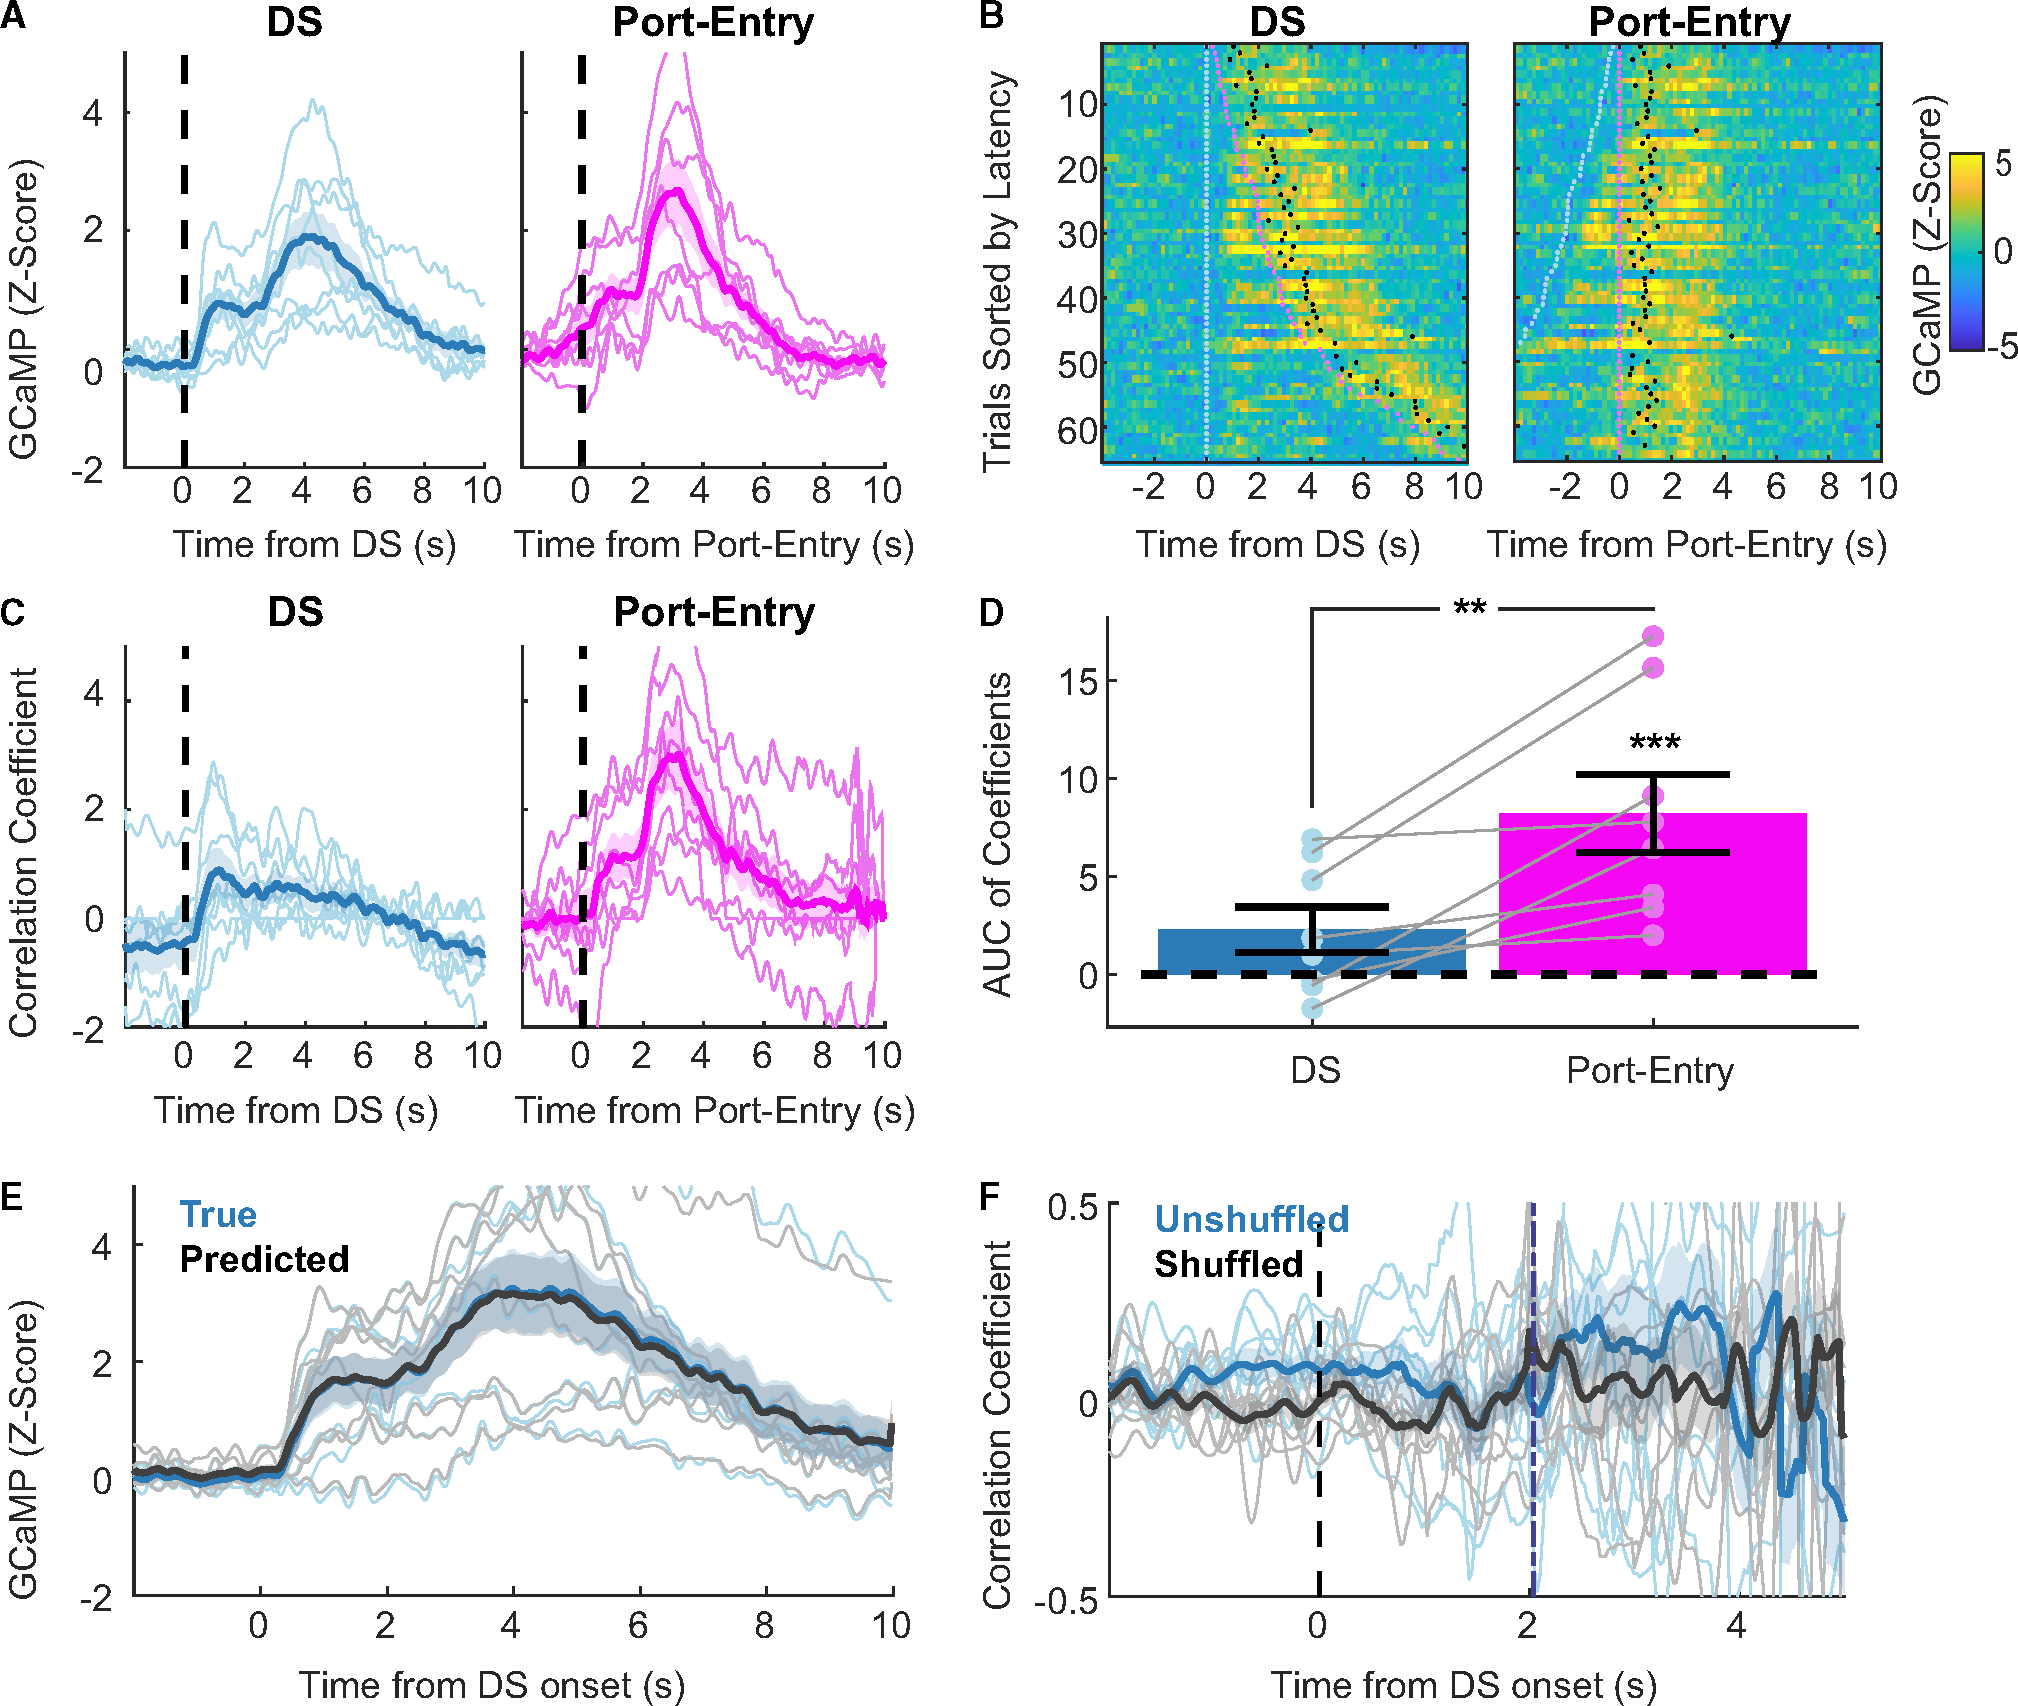
(A) Peri-event calcium traces time-locked to distinct task events (blue = DS onset, pink = first port entry) from sessions with a delay between port entry and reward delivery. Lines with shading indicate between-subject mean ± SEM (n = 8 rats). Individual points and lines without shading indicate individual subject means.
(B) Peri-event heat plots of GCaMP signal with port entry outcome (n = 1 representative subject). Trials sorted by port entry latency with event onset points overlaid (light blue = DS onset, pink = first port entry, black = first lick).
(C) Regression kernel traces for DS trial events (blue = DS onset, pink = first port entry) generated by encoding model. Lines with shading indicate between-subject mean ± SEM (n = 8 rats). Individual points and lines without shading indicate individual subject kernels.
(D) Distribution of event kernel AUCs from 0 to +5 s (**, main effect of event type F(1, 7) = 14.372, p = 0.007; ***, port entry vs. zero, t(10.9) = 5.053, p < 0.001). Individual points and lines without shading indicate individual subject AUCs.
(E) Mean true (blue) and predicted (black) peri-DS onset GCaMP traces from encoding model trials (r(3,838) = 0.997, p < 0.001). Lines with shading indicate between-subject mean ± SEM (n = 8 rats). Individual points and lines without shading indicate individual subject means.
(F) Correlation between GCaMP signal at each 0.025-s time bin sampled and port entry latency (blue = true latency, gray = shuffled latency). Purple dashed line represents mean port entry latency (2.0379 s after DS onset). Lines with shading indicate between-subject mean ± SEM (n = 8 rats). Individual points and lines without shading indicate individual subject means.
To evaluate the relationship between VP→VTA bulk calcium activity and DS task events, we ran an encoding model to generate event correlation “kernels” or estimates of the temporal association between each event and the GCaMP signal (Figure 3C). To dissociate the degree to which VP→VTA activity was related to cue presentation and/or animals’ reward seeking, we included DS onset and first-port-entry events in our model. We also tested a version of the encoding model that included the first-lick event as well, but we found that first-lick events were highly collinear with the first-port-entry events and thus did not improve the model’s fit, so we proceeded with the simpler two-event model. Briefly, the encoding model used shifted versions of the event onset timings (with one shift for every possible time bin in a trial from −2 to 10 s post-DS onset) as predictors in a regression. Thus, resulting regression kernels represent the best fit coefficients, or predictive value, of each event throughout the time course of a trial (Figure 3C). To quantitatively compare event kernels, we computed AUCs from 0 to 5 s (Figure 3D). We found that the AUC of the port entry kernel, but not the DS kernel, was significantly different from zero (t(10.9) = 5.053, p < 0.001). In addition, port entry kernel AUCs were greater in magnitude than the DS kernel AUC (main effect of event type F(1, 7) = 14.372, p = 0.007; pairwise difference t(7) = 3.791, p = 0.007). Importantly, the model accurately predicted the actual GCaMP signal for each trial using event timings alone (Figure 3E; r(3,838) = 0.997, p < 0.001). The encoding model results suggest that VP→VTA activity on DS trials is not driven by cue presentation but is primarily related to events following port entry.
Population-level VP→VTA calcium activity does not encode the vigor of cue-elicited reward seeking
Prior extracellular recordings identified a subset of VP neurons that encode incentive motivational value of cues during the DS task, measured by port entry latency.15,16 We have also found similar correlations between port entry latency and peri-cue population-level calcium activity in VP GABA neurons.34 To determine whether VP→VTA calcium activity on DS trials is predictive of reward-seeking vigor, we ran a correlation between the pericue, pre-port entry GCaMP6f signal in each 0.025-s time bin sampled and latency of port entry on a trial-by-trial basis (Figures 3F and S3). To compare resulting coefficients against chance, we also ran a shuffled version of this correlation analysis in which port entry latencies were shuffled randomly between trials prior to correlation. Contrary to our initial hypothesis, we found no significant correlation between VP→VTA activity and port entry latency, no pairwise differences between the true and shuffled correlations, and no interaction with time from cue (interaction of time and true versus shuffled, F(575, 6,511) = 1.03, p = 0.31), though we found a significant overall difference between true versus shuffled correlations (F(1, 6,511) = 59.910, p < 0.001) and a main effect of time (F(575, 6,511) = 1.256, p < 0.001). We also examined the relationship between VP→VTA calcium activity time-locked to port entry and the trial-by-trial variation in the number of licks recorded (Figure S4), and we found no significant correlations at any time point and no effect of time (main effect of time, F(600, 8,407) = 1.0548, p = 0.1797; interaction of time and true versus shuffled, F(600, 8,407) = 0.76, p = 1.00), though we found a significant overall difference between true versus shuffled independent of time from port entry (true versus shuffled, F(1, 8,407) = 42.35, p < 0.001).
Acute cue-paired optogenetic stimulation of VP→VTA neurons does not impact probability or vigor of reward seeking
To determine whether VP→VTA causally promotes cue-elicited reward seeking, we performed cue-paired optogenetic manipulations of these neurons during the DS task by virally expressing ChR2 and delivering laser through fiber optic implants (Figure 4A; Figure S5). We tested the impact of VP→VTA excitation in two separate sessions, with distinct laser durations (Figure 4B). To emulate transient “cue” responses reported in prior recordings from VP neurons, we ran sessions where 50% of cues were paired with laser delivery (20 Hz), starting at cue onset and terminating after 1 s. To manipulate VP activity throughout the entire cue duration, we ran sessions where 50% of cues were paired with laser delivery (20 Hz), starting at cue onset and terminating once the animal made a port entry or at 10 s if the animal failed to enter the port. To determine the specificity of behavioral effects to VP→VTA neurons, we performed the same manipulations in VP neurons that project to mediodorsal thalamus (VP→mdThal; Figure S5).
Figure 4. Cue-paired optogenetic stimulation of VP→VTA and VP→mdThal neurons during the DS task.
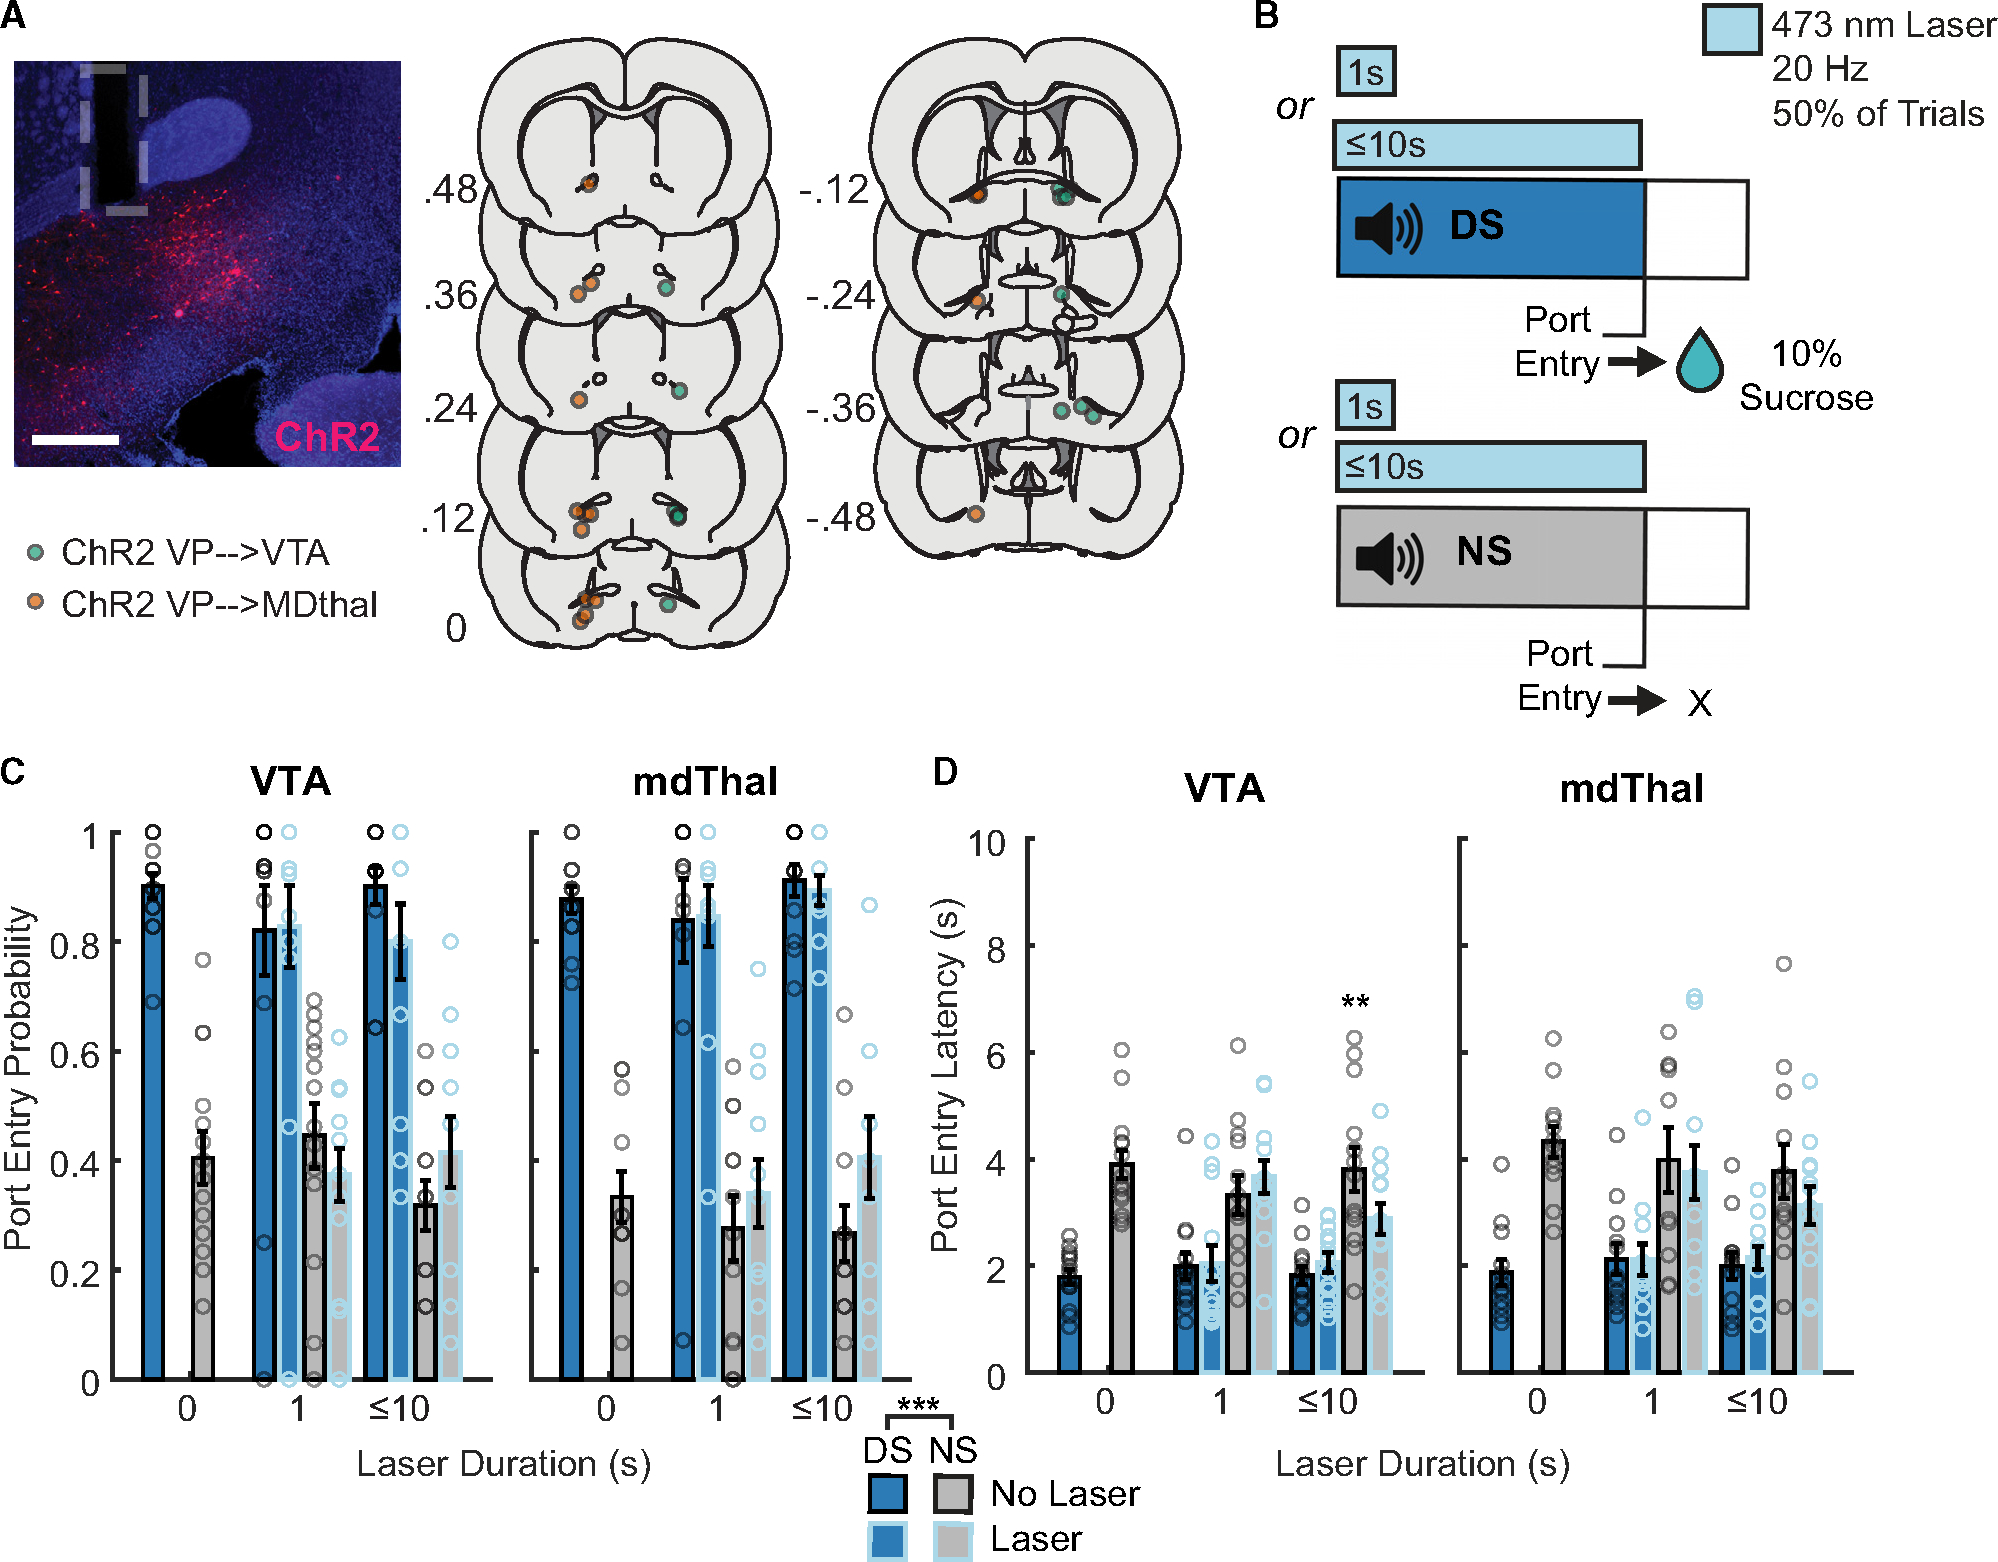
(A) Representative image of ChR2 expression (red) and optic fiber tract (gray outline) in the VP; scale bar represents 500 μm (left). Coordinates of optic fiber implant tips of subjects in VP→VTA ChR2 group (n = 14 rats; green) and VP→mdThal ChR2 group (n = 12 rats, orange) (right).
(B) Diagram of DS task optogenetic stimulation.
(C) Probability of port entry of VP→VTA ChR2 group (left) and VP→mdThal group (right) on trials (blue = DS, gray = NS) with and without laser (black outline = no laser, blue outline = laser paired) on sessions prior to optogenetic stimulation, 1-s acute stimulation sessions, and ≤10-s cue-paired sessions. Bars and error bars indicate between-subject mean ± SEM. Individual points indicate individual subject means.
(D) Latency to port entry of VP→VTA ChR2 group (left) and VP→mdThal group (right) on trials (blue = DS, gray = NS) with and without laser (black outline = no laser, blue outline = laser paired) on sessions prior to optogenetic stimulation, 1-s acute stimulation sessions, and ≤10-s cue-paired sessions. Bars and error bars indicate between-subject mean ± SEM. Individual points indicate individual subject means. **, VP→VTA latency to port entry, ≤10-s stimulation laser-paired NS trials vs. laser-unpaired NS trials, t(36) = 2.759, p = 0.0185. ***, main effect of cue, VP→VTA main effect of cue F(1, 26) = 85.438, p < 0.001; VP→mdThal, main effect of cue, F(1, 22) = 108.96, p < 0.001.
Prior to optogenetic manipulation sessions, rats in both groups learned to preferentially respond to reward cues. This was reflected in both an increased probability of port entry during the DS (VP→VTA main effect of cue F(1, 26) = 85.438, p < 0.001; VP→mdThal, main effect of cue, F(1,22) = 108.96, p < 0.001), and faster port entries during the DS than the NS (VP→VTA main effect of cue F(1, 13) = 59.756, p < 0.001; VP→mdThal, main effect of cue F(1, 11) = 76.163, p < 0.001). To assess the impact of optogenetic excitation on cue-elicited reward seeking, we compared probability and latency of port entry between laser-paired and laser-unpaired trials. When we tested the impact of optogenetic excitation on 50% of trials, we found no significant impact of acute 1-s optogenetic stimulation of VP→VTA on port entry probability (Figure 4C; main effect of laser F(1, 39) = 0.479, p = 0.493; interaction of cue and laser F(1, 39) = 0.708, p = 0.405) or latency (Figure 4D; effect of laser F(1, 36) = 0.545, p = 0.465; interaction of cue and laser F(1, 36) = 0.298, p = 0.589). We also found no impact of acute 1-s optogenetic stimulation of VP→mdThal on port entry probability (main effect of laser F(1, 33) = 0.519, p = 0.476; interaction of cue and laser F(1, 33) = 0.320, p = 0.575) or latency (main effect of laser F(1, 30.215) = 0.274, p = 0.605, interaction of cue and laser F(1, 30.215) = 0.246, p = 0.623). In these 1-s optogenetic manipulation sessions, rats in both groups maintained a significantly higher probability of responding to the DS than the NS (VP→VTA, main effect of cue, F(1, 39) = 79.116, p < 0.001; VP→mdThal, main effect of cue, F(1, 33) = 116.289, p < 0.001). Both groups also continued to enter the port more quickly in response to the DS than the NS (VP→VTA, main effect of cue, F(1, 36) = 30.272, p < 0.005; VP→mdThal, main effect of cue, F(1, 30.215) =22.565,p<0.001). These results suggest that activation of either pathway on the timescale on which correlations between VP single unit activity and latency have been reported is insufficient to alter the likelihood or latency of cue-elicited reward seeking.
In the ≤10-s optogenetic stimulation sessions, we found no significant effect of optogenetic stimulation in the VP→mdThal group on either port entry probability (Figure 4C; main effect of laser, F(1, 33) = 1.639, p = 0.209; interaction of cue and laser F(1, 33) = 2.782, p = 0.105) or latency (Figure 4D; main effect of laser, F(1, 33) = 0.701, p = 0.409; interaction of cue and laser, F(1, 33) = 1.839, p = 0.184). These animals maintained preferential responding to the DS with an increased port entry probability (main effect of cue, F(1, 33) = 144.680, p < 0.001) and shorter port entry latency (main effect of cue, F(1, 33) = 22.171, p < 0.001). In contrast, optogenetic stimulation ≤10 s altered cue responses in the VP→VTA group, especially on NS trials. Specifically, activation of VP→VTA impacted port entry latency in a cue-specific manner (interaction of cue and laser, F(1, 36) = 6.034, p = 0.0190) in that rats entered the port more quickly on NS-paired laser trials compared to NS trials without laser (t(36) = 2.759, p = 0.0185). While we observed a significant cue by laser interaction for port entry probability (F(1, 36) = 4.204, p = 0.0477), this was not explained by any significant post hoc pairwise differences between laser and no lasers trials for either the DS or the NS, though port entry probability appeared slightly lower on average on DS laser trials and slightly higher on average on NS laser trials, suggested some disruption in discrimination. Overall, we did not see any significant effects of pathway-specific excitation on DS-evoked behavior.
Sucrose-paired optogenetic stimulation of VP→VTA neurons, but not VP→mdThal neurons, biases choice
To determine the impact of reward-paired VP→VTA or VP→mdThal neuron activation on instrumental reward seeking and consumption, rats in both groups performed a separate lever choice task with optogenetic stimulation (Figure 5A). In this task, presses on an “inactive” lever resulted in sucrose delivery alone, while presses on an “active” lever resulted in sucrose delivery along with lick-paired optogenetic stimulation. Once pressed, levers were retracted until 8 s after licking was detected, ensuring no additional lever pressing could occur until reward was sampled.
Figure 5. Lever choice task with reward-paired optogenetic stimulation.
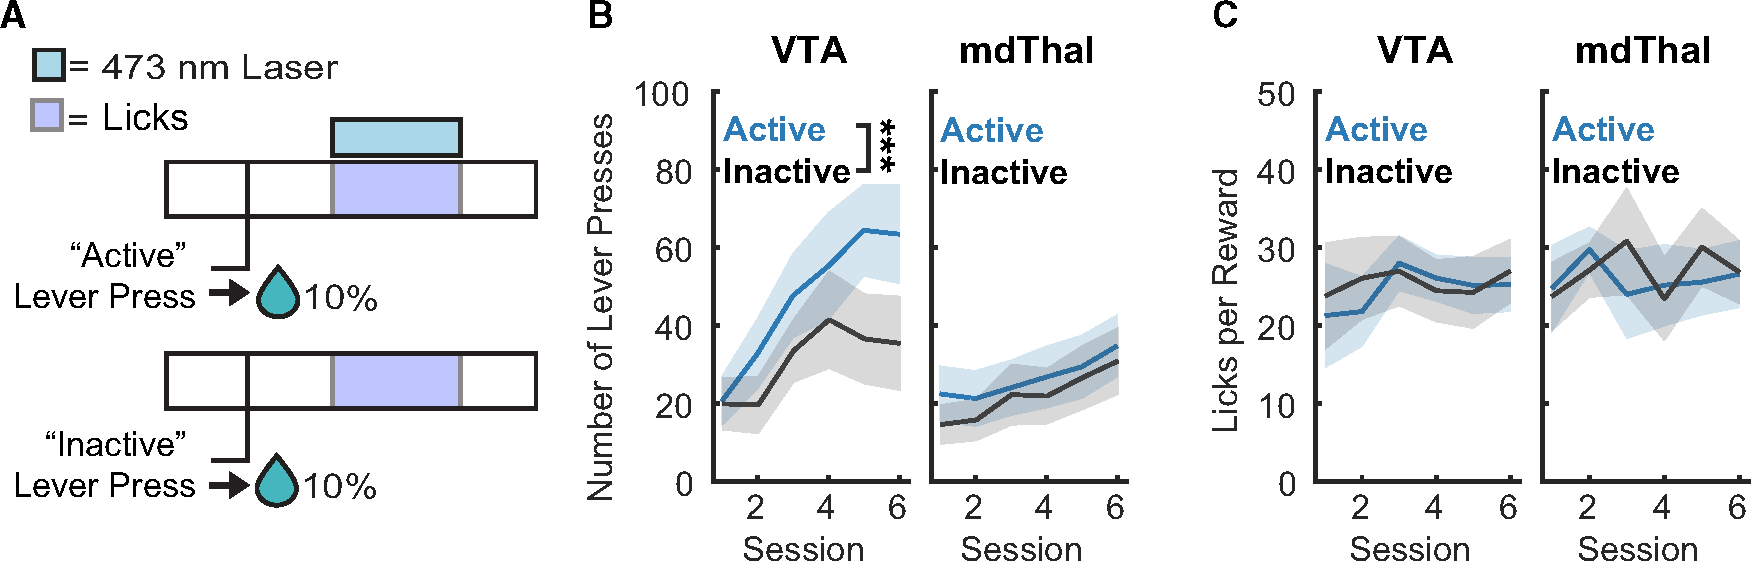
(A) Lever choice task design.
(B) Lever presses (blue = active, gray = inactive) during lever choice task sessions for VP→VTA ChR2 group (n = 14 rats, left; ***, main effect of lever F(1, 154) = 8.132, p = 0.005) and VP→mdThal ChR2 group (n = 15 rats, right).
(C) Licks per reward delivered during lever choice task sessions for the VP→VTA ChR2 group (left) and VP→mdThal ChR2 group (right). Lines with shading indicate between-subject mean ± SEM.
We found that the VP→VTA, but not the VP→mdThal group, developed a preference for the laser-paired lever (Figure 5B) (VP→VTA, main effect of lever, F(1, 154) = 8.132, p = 0.005; VP→mdThal, main effect of lever, F(1, 165) = 1.684, p = 0.196). It is possible that VP→VTA rats developed an active lever preference because optogenetic stimulation of VP→VTA neurons enhanced the hedonic value of sucrose. Since frequency of licking is associated with a substance’s hedonic value in rodents,35–39 we compared licks per reward delivered with or without lick-paired laser delivery to determine this. We found no significant impact of lick-paired optogenetic stimulation on licking behavior during these sessions (Figure 5C; VP→VTA, main effect of lever type, F(1, 82.155) = 0.290, p = 0.592, interaction of lever type and session, F(5, 82.155) = 0.393, p = 0.852; VP→mdThal, main effect of lever type, F(1, 84.05) = 0.1689, p = 0.682, interaction of lever type and session, F(5, 84.050) = 0.3743, p = 0.865), suggesting that preference for the active lever in the VP→VTA group did not depend on any impact on hedonic evaluation of the sucrose itself during stimulation. However, we were unable to determine precise time points at which rats finished consuming the total volume of sucrose delivered on each trial, so future investigation into how VP→VTA neurons mediate hedonic evaluation using other methods is warranted. Since optogenetic stimulation in this task required execution of a complex action sequence (active lever press → reward cup entry → licking), we ran intracranial self-stimulation (ICSS) sessions to directly test if optogenetic stimulation of VP→VTA or VP→mdThal can reinforce a new operant response.
Stimulation of VP→VTA neurons is reinforcing
Optogenetic manipulations in the DS task and choice task occurred concurrently with cue and reward consumption, respectively. To assess the sufficiency of VP→VTA neurons to reinforce behavior in the absence of primary reward and associated cues, rats completed ICSS sessions in which an “active” nose poke on one side of the chamber yielded optogenetic stimulation (Figure 6).
Figure 6. Intracranial self-stimulation (ICSS) task.
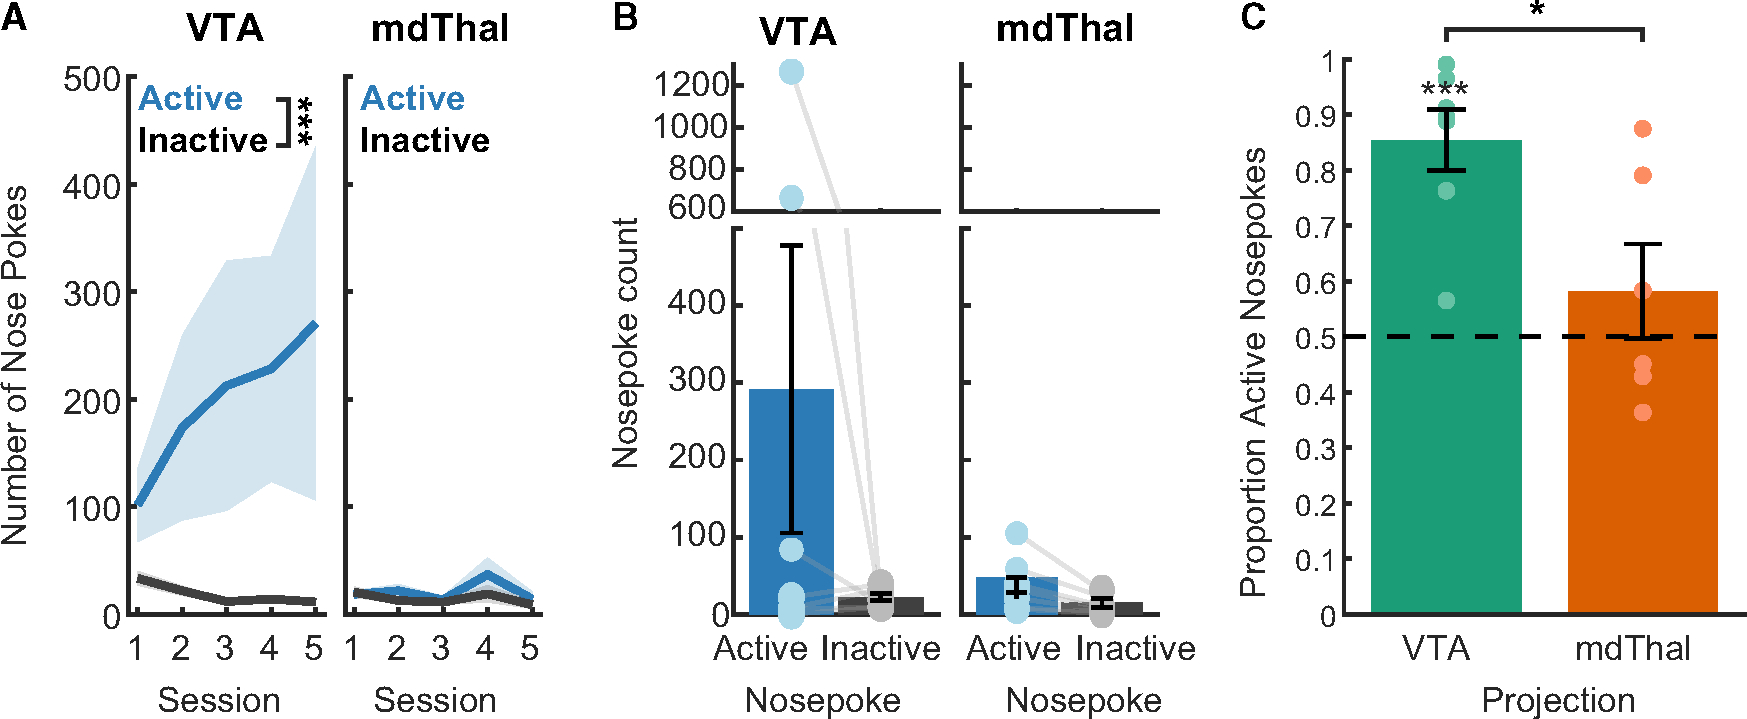
(A) Nose pokes (blue = active, gray = inactive) for VP→VTA ChR2 (n = 7 rats, left; ***, main effect of nose poke F(1, 54) = 20.248, p < 0.001) and VP→mdThal (n = 6 rats, right; effect of nose poke F(1, 54) = 3.505, p = 0.066) groups in the initial training phase. Lines with shading indicate between-subject mean ± SEM.
(B) Nose pokes (blue = active; gray = inactive) for VP→VTA ChR2 (left; effect of nose poke F(1, 5.974) = 2.484, p = 0.166) and VP→mdThal ChR2 (right; effect of nose poke F(1, 6) = 0.836, p = 0.396). Bars indicate between-subject mean ± SEM. Individual points and lines indicate individual subject means.
(C) Proportion of active nose pokes for each viral group (green = VP→VTA ChR2; orange = VP→mdThal; ***, significant difference from chance t(6) = 6.393, p < 0.001; *, main effect of projection F(1) = 7.601, p = 0.019).
In these ICSS sessions, VP→VTA group rats preferentially entered the active nose poke, measured by nose poke count (Figure 6A; main effect of nose poke type, F(1, 54) = 20.248, p < 0.001; interaction of nose poke type and session, F(4, 54) = 0.669, p = 0.616) and proportion of active nose pokes significantly different from chance in the final session (Figure 6C; t(6) = 6.393, p < 0.001). These data are consistent with other reports that optogenetic stimulation of VP→VTA is reinforcing in mice.7 In contrast, VP→mdThal group pressed active and inactive nose pokes at similar rates, failing to engage in significant self-stimulation (main effect of nose poke type, F(1, 54) = 3.505, p = 0.067, interaction of nose poke type and session F(4, 54) = 0.958, p = 0.438). In the final session, the VP→mdThal group’s proportion of active nose pokes did not differ from chance (t(5) = 0.963, p = 0.380), and it was significantly lower compared to the VP→VTA group (effect of projection F(1) = 7.601, p = 0.019). Overall, the ICSS data suggest that VP outputs to the VTA, but not the mdThal, are powerfully and immediately reinforcing.
DISCUSSION
In this study, we found VP→VTA calcium responses on DS trials signaling reward availability but not control trials. Using an encoding model to quantify the temporal relationship between calcium activity and task events, we report that population-level VP→VTA calcium activity primarily increases following port entry. Critically, we did not find a significant correlation between calcium activity and response latency. We also used in vivo optogenetics to acutely manipulate activity of VP→VTA neurons as well as VP neurons that project to the mediodorsal thalamus, another major output of VP, during cue presentations in the DS task. We found no impact of DS-paired VP→VTA stimulation on probability or latency of port entry. In addition, we found that optogenetic stimulation of VP→VTA neurons paired with sucrose consumption biases choice in a lever choice task and that VP→VTA optogenetic stimulation alone is sufficiently reinforcing to support ICSS. Overall, these data suggest that VP→VTA neurons are robustly recruited during sucrose consumption and that these neurons support reinforcement but do not encode the vigor of reward seeking or the incentive motivational value of cues.
Lack of incentive value and vigor encoding by VP→VTA neurons in the DS task
Though prior work has reported vigor encoding by single units within VP15–17 and population-level recordings from GABAergic VP neurons34 in the DS task, we did not find vigor encoding in population-level VP→VTA calcium recordings. Prior electrophysiology recordings during the DS task have identified VP neurons that respond to the DS and predict port entry latency within 300 ms of cue onset.15–17 While calcium sensor kinetics are slower and may not necessarily reflect cell spiking,40 latency encoding was still detected within 2 s of DS onset in recent photometry recordings from GABAergic VP neurons.34 Therefore, if VP→VTA neurons similarly predicted vigorous port entry in the DS task, we would expect to find port entry latency encoding and impacts of optogenetic stimulation at similar timescales (within 2 s of DS onset). In addition, DS-paired optogenetic stimulation of VP→VTA neurons did not change response vigor. These results suggest that activation of these neurons at the timescale on which correlations between VP single unit activity and latency have been reported is insufficient to alter the likelihood or latency of cue-elicited reward seeking.
While the largest increases in VP→VTA calcium activity consistently occurred following port entry, smaller peaks were observed in a subset of subjects ~1 s after DS onset. The variability between subjects is interesting and may reflect some individual differences in cue processing or incentive value attribution. Indeed, individual differences in cue-evoked VP neuronal activity have been observed between individuals exhibiting “sign-tracking” and “goal-tracking” behavior in response to Pavlovian cues,41 and changes in incentive value of cues have also been associated with changes in VTA dopaminergic signaling.42–44 These differences are well documented in Pavlovian paradigms with visual cues,45,46 but it is unclear whether individual differences in incentive value attribution to cues manifest similarly in instrumental paradigms such as the DS task. Future work should investigate these individual differences and the generalizability of our VP→VTA findings to distinct behaviors elicited by Pavlovian cues.
Role of VP→VTA neurons in motivated behavior
Our results suggest that VP→VTA neurons are reinforcing but do not contribute to response invigoration by cues and reward. We report optogenetic stimulation of VP→VTA neurons supports ICSS in rats, consistent with prior work in mice showing activation of GABAergic VP→VTA neurons is reinforcing.7 There were noteworthy differences in the magnitude of ICSS effects between subjects within the VP→VTA group. Though we did not observe a clear pattern of subregional (rostral versus caudal or medial versus lateral) implant placements associated with stronger effects here, subregional differences in VP function have been reported.4,5,12 Additionally, some variability in our photometry and behavioral findings may be due to differential recruitment of GABAergic versus glutamatergic neurons.
Our observation of robust VP→VTA calcium activation during sucrose consumption, coupled with our findings that optogenetic stimulation of VP→VTA neurons paired with sucrose consumption biases choice, suggests that VP→VTA neurons may encode some aspect of the value of reward consumed and reinforce seeking behavior accordingly. From a circuit perspective, reinforcement may occur through disinhibition of dopaminergic VTA neurons from VTA GABAergic interneurons by reward-evoked GABAergic VP→VTA activity.7,47 GABAergic VTA neurons are not homogeneous, and GABAergic VTA projections have themselves been associated with motivated behavior.48 Recent work shows that GABAergic neurons projecting from the VTA to the VP encode information about reward value and that optogenetic stimulation of these projections enhances motivation to seek reward without providing robust reinforcement.49 Thus, VP and VTA seem to provide reciprocal feedback about the value of rewards consumed to support learning and efficient reward capture.
Interestingly, we found that optogenetic stimulation of VP→VTA neurons paired with sucrose consumption biases choice without impacting the hedonic value of sucrose, as measured by licking behavior. This finding contrasts with other work demonstrating that optogenetic stimulation of ventral arkypallidal projections to the nucleus accumbens shell paired with sucrose consumption enhances the hedonic value of sucrose,50 reaffirming the diverse functional roles of VP output pathways. Our data suggest that VP→VTA neuron activation may bias seeking behavior independently of experienced outcome value. This potential disconnection between seeking behavior and hedonic value is noteworthy, since compulsive seeking despite negative affective outcomes observed in addiction is associated with changes in VTA dopaminergic signaling.1,43,44 Since animals only received liquid sucrose reward in our experiments, the relationship between VP→VTA activity and outcome representation more generally, including other consummatory rewards, aversive outcomes, and non-consummatory outcomes, requires further study. It is also possible that VP→VTA processing of drug cues and outcomes may vary, since prior work has shown drug-specific differences in VP circuit processing of drug cues.12,51
Reconciling these data with prior reports of VP→VTA circuit roles in cued reinstatement
Past work investigating the role of VP→VTA neurons in cue-elicited reward seeking12,13 has largely been limited to cue-induced reinstatement paradigms that test the ability of action-contingent presentations of a Pavlovian drug-conditioned stimulus to reinstate extinguished drug-seeking behavior. In other words, animals perform operant seeking behavior to “earn” drug cue presentations in the absence of drug. Thus, reinstatement of extinguished behavior observed in these paradigms may not reflect drug seeking or craving per se but may instead be due to conditioned reinforcement by drug cues.25–27 Though we did not observe a consistent DS response here, contingent delivery of Pavlovian drug cues in past studies may have elicited sufficient VP→VTA activation to reinforce seeking behavior. Other work has investigated VP→VTA contributions to noncontingent drug “cues” in a context renewal paradigm,10 but this work used a serial chemogenetic disconnection approach that may have also disrupted the reciprocal projections from VTA to the VP or bisynaptic connectivity via other structures.5,48,52 Thus, the degree to which VP→VTA neurons contribute to context-induced relapse remains unclear. Since the relapse models used in prior work test reinstatement of seeking behavior following extinction, it’s also possible that durable changes in VP→VTA activity occur during extinction learning or in the absence of drugs, which make animals susceptible to relapse. This highlights a need for more basic understanding of how VP→VTA circuit function changes with experience and reflects internal states.
Effects of VP→mdThal optogenetic stimulation
Relative to many other VP output pathways, the role of VP→mdThal in motivated behavior is not well understood. This pathway is broadly implicated in consolidation of action-outcome contingencies.6,53 Prior work has reported dissociable roles of VP→mdThal and VP→VTA neurons in Pavlovian-to-instrumental transfer,31 a phenomenon thought to reflect the incentive value of cues in which noncontingent Pavlovian cue presentations increase instrumental reward-seeking behavior despite the absence of the primary reinforcer. Similarly, we report dissociable effects of optogenetic manipulations of these pathways. Notably, we found that optogenetic stimulation of VP→mdThal neurons did not support ICSS. This suggests that, while this pathway may be important for reward learning,6,53 its activation is not directly reinforcing. In addition, we found that optogenetic stimulation of VP→mdThal neurons paired with sucrose consumption did not impact choice behavior in the lever choice task, in contrast to our VP→VTA findings. Finally, we did not find any impact of cue-paired optogenetic stimulation of VP→mdThal neurons on probability or vigor of seeking behavior in rats trained in the DS task. Since these manipulations occurred in well-practiced rats, this finding is consistent with prior reports that mdThal is important for consolidation but not the expression of learned instrumental reward seeking.53 Altogether, our results suggest that cue-paired VP→mdThal neuronal activity is not sufficient to promote generalized seeking in response to cues, and it is insufficient to alter outcome representations or bias instrumental action selection. More work is required to investigate mechanisms by which VP→mdThal contributes to outcome-guided behavior. In particular, fiber photometry calcium recordings from VP→mdThal throughout DS task training could reveal how activity of these neurons correlates with learning.
Limitations of the study
Prior work demonstrates that GABAergic and glutamatergic VP neurons have functionally opposing activity patterns in vivo, generally associated with approach and avoidance respectively.7,8 While the majority of VP neurons are GABAergic,4,5 the viral approach used in this study did not target specific neuronal subpopulations based on neurochemical identity but based on projection target. Based on our RNAscope analyses, our strategy predominantly targeted GABAergic neurons but included some neurons that also expressed glutamatergic markers. Future work should aim to dissociate differential roles of GABAergic and glutamatergic VP→VTA neurons. Furthermore, photometry as a method is biased toward detecting synchronous changes in population activity, so future work interrogating specific VP→VTA cell types may reveal more nuanced roles of these neurons in cue-elicited reward seeking. In addition, GCaMP6f reporter kinetics are slow compared to electrophysiological recording methods, and signal may integrate over time. While we did not directly measure electrophysiological response of VP→VTA neurons to optogenetic stimulation, ChR2 stimulation of mice VP neurons has been shown to elicit excitatory responses in VP as well as direct postsynaptic responses in VTA.7 Thus, acute laser delivery should have stimulated VP→VTA neurons, though it is unclear what the prolonged ≥10-s stimulation has on a cellular and circuit level. We chose to optically stimulate at 20 Hz to emulate endogenous frequency of cue responses observed in prior electrophysiological recordings from the DS task.15–17 However, recent work has shown that mice prefer optogenetic stimulation of GABAergic VP neurons at 40 Hz.7 Given this preference for 40 Hz, 40-Hz stimulation may have distinct behavioral effects. We did not include a direct negative control viral group without opsin expression in this study, but we did include VP→mdThal, another major output of VP, as a comparison group and found dissociable effects. While VP neurons projecting to the VTA and mdThal seem mostly distinct,31 some of these neurons may collateralize to other target regions, and some project to both VTA and mdThal.54,55 Nevertheless, if light delivery or heating was impacting behavior in a non-circuit-specific manner, we would expect to see behavioral effects in both viral groups. In addition, we included laser-unpaired sessions, trials, and operands to provide within-subject controls for effects of laser delivery. It is possible that pairing 50% of cues with laser stimulation in DS task test sessions may have confounded assessments of incentive motivation with new learning. However, we did not observe any changes in DS- or NS-associated behavior on no-laser trials or subsequent no-laser test sessions, which would be indicative of new cue learning. Finally, we are limited in our ability to assess the potential influence of sex on these results as our photometry recordings were conducted only in female rats, and our optogenetic experiments are not sufficiently powered to assess the impact of sex as a biological factor.
Conclusions and future directions
Taken together, results from this study suggest that VP→VTA neurons are active during the consumption of natural rewards and that this activity reinforces seeking behavior. Critically, we found that VP→VTA population-level calcium signals do not encode reward-seeking vigor in a DS task, and that cue-paired VP→VTA optogenetic stimulation in this task does not impact the vigor of reward seeking. Thus, a key question remains: if not VP→VTA neurons, what VP single units encode vigor of instrumental responding to cues15–17? Photometry recordings collected in our lab revealed GABAergic VP neuron calcium activity encodes response vigor in the DS task.34 There may be no single VP “output pathway” responsible for controlling vigor, but coordinated recruitment of GABAergic VP neurons is critical for controlling animals’ motivational state.7,8 Future work interrogating the contributions of more specific VP→VTA cell types7,10,11,47 or individual neuronal responses may reveal more nuanced roles of these neurons in cue-elicited reward seeking.
STAR★METHODS
RESOURCE AVAILABILITY
Lead contact
Further information and requests for resources and reagents should be directed to and will be fulfilled by the lead contact, Dr. Jocelyn Richard (richardj@umn.edu).
Materials availability
This study did not generate new unique reagents.
Data and code availability
All data reported in this paper will be shared by the lead contact upon request. Processed data for statistical analysis is available in an online repository and is publicly available as of the date of acceptance for publication. The DOI is listed in the key resources table.
All original analysis code has been deposited and made publicly available as of the date of acceptance for publication. DOIs are listed in the key resources table.
Any additional information required to reanalyze the data reported in this paper is available from the lead contact upon request.
KEY RESOURCES TABLE.
| REAGENT or RESOURCE | SOURCE | IDENTIFIER |
|---|---|---|
|
| ||
| Antibodies | ||
|
| ||
| Mouse anti-mCherry | Living Colors | 632543; RRID:AB_2307319 |
| Rabbit anti-cFos | Synaptic Systems | 226 008; RRID:AB_2891278 |
| Alexa 555 Donkey anti-mouse | Invitrogen | A-31570; RRID: AB_2536180 |
| Alexa 488 Donkey anti-rabbit | Invitrogen | A-21206; RRID:AB_2535792 |
|
| ||
| Bacterial and virus strains | ||
|
| ||
| AAVrg- pmSyn1-EBFP-Cre | Hongkui Zeng (Madisen et al.)56 | Addgene 51507-AAVrg |
| AAV9-EF1a-double floxed-hChR2(H132R)-mCherry-WPRE-HGHpa | Karl Deisseroth | Addgene 20297-AAV9 |
| AAV9-hSyn-Flex GCaMP6f-WPRE-SV40 | Douglas Kim and GENIE Project (Chen et al.)57 | Addgene 100833-AAV9 |
| AAV8-hSyn-DIO mCherry | Bryan Roth | Addgene 50459-AAV8 |
|
| ||
| Chemicals, peptides, and recombinant proteins | ||
|
| ||
| Carprofen injectable solution | Santa Cruz Biotechnology, Inc. | sc-395914Rx |
| Vectashield mounting medium | VectorLabs | H-1000-10 |
| Jet liquid clear | Lang Dental | N/A |
| Jet denture repair powder | Lang Dental | N/A |
|
| ||
| Critical commercial assays | ||
|
| ||
| RNAscope Multiplex Fluorescent Reagent Kit v2 | ACDBio | 323270 |
| RNAscope mCherry probe | ACDBio | 431201 |
| RNAscope Rn-Slc17a6-C2 probe | ACDBio | 317011-C2 |
| RNAscope Rn-Gad1-C3 probe | ACDBio | 316401-C3 |
|
| ||
| Deposited data | ||
|
| ||
| Processed data for statistical analysis | Current paper | https://doi.org/10.5281/zenodo.10059759 |
|
| ||
| Experimental models: Organisms/strains | ||
|
| ||
| Long Evans (Blue Spruce) outbred rats | Envigo/Inotiv | HsdBlu:LE |
|
| ||
| Software and algorithms | ||
|
| ||
| MATLAB | Mathworks | RRID:SCR_001622 |
| R | The R Project | https://cran.r-project.org/mirrors.html |
| Python | Python | https://www.python.org/downloads/ |
| Synapse software | Tucker-Davis Technologies | https://www.tdt.com/component/synapse-software/ |
| HALO Image Analysis Platform | Indica Labs | RRID:SCR_018350 |
| ImageJ | Schneider et al.58 | https://ImageJ.net/ij/download.html |
| Behavioral event encoding model | Parker et al.59 | https://github.com/nfparker/event_encoding_model |
| airPLS algorithm | Zhang et al.60 | https://github.com/zmzhang/airPLS |
| Fiber photometry analysis code | Current paper | https://doi.org/10.5281/zenodo.10366545 |
| Optogenetics analysis code | Current paper | https://doi.org/10.5281/zenodo.10366408 |
| Statistical analysis code | Current paper | https://doi.org/10.5281/zenodo.10059759 |
| Gramm | Morel61 | https://github.com/piermorel/gramm |
|
| ||
| Other | ||
|
| ||
| Fiberoptic cannula for optogenetics | RWD Life Science Inc. | R-FOC-BF300C39NA |
| Fiberoptic cannula for fiber photometry | Doric Lenses | MFC_300/330–0.37_9mm_MF2.5_FLT |
| Mono fiberoptic patchcords | Doric Lenses | MFP_400/460/900–0.48_1m_FCM-MF1.25 |
| Fiber photometry workstations | Tucker-Davis Technologies | RZ5P |
| Newport photoreceivers | Doric Lenses | NPM_2151_FOA_FC |
| Fluorescence Minicubes | Doric Lenses | FMC4_AE(405)_E(460–490)_F(500–550)_S |
| LED driver | Thor Labs | DC4104 |
| Connectorized LD: 405 nm | Doric Lenses | CLED_405 |
| Connectorized LD: 465 nm | Doric Lenses | CLED_465 |
| Confocal microscope | Nikon | AX R |
| Deconvolution microscope | Nikon | Ti-E |
| Dual small animal stereotaxic instrument | David Kopf Instrumental | Model 942 |
| Cryostat | Leica Biosystems | CM1900 |
EXPERIMENTAL MODEL AND STUDY PARTICIPANT DETAILS
Subjects
Maleand female adult Long-Evansrats (Envigo, n = 55, 29 female), 60–110 days old and weighing 250–275g upon arrival were used. Rats were initially pair-housed under a standard 12:12 Light:Dark cycle on ventilated racks. We are limited in our ability to assess the potential influence of sex on these results as our photometry recordings were conducted only in female rats, and our optogenetic experiments are not sufficiently powered to assess the impact of sex as a biological factor. Following surgery, rats were housed singly. Water and food were available in home cages ad-libitum throughout most of the experiments, except during the choice task experiment. During this experiment, rats were mildly food restricted to 90% of their body weight. All behavioral testing occurred during the light phase. All experimental procedures were approved by the Institutional Animal Care and Use Committee at the University of Minnesota and were carried out in accordance with the guidelines on animal care and use of the National Institutes of Health of the United States.
METHOD DETAILS
Experimental design
Each experiment described incorporated within- and between-subject controls to minimize the influence of confounding variables. For photometry recordings, motion artifacts were removed within-subject using a 405nm isosbestic, calcium-independent signal recorded in parallel to the 465nm calcium-dependent signal.62 Photometry signals were z-scored on a trial-by-trial basis to normalize between-subjects. Behavioral tasks included control stimuli and operands in addition to reward-associated stimuli and operands. The DS task included presentations of a neutral control cue (NS) as well as the DS to account for general impacts of auditory stimuli on neural activity and behavior. Cue identity of the DS and NS was counter-balanced between-subjects. To assess specificity of manipulating distinct VP subpopulations during similar epochs, we performed similar optogenetic manipulations of VP neurons projecting to the mediodorsal thalamus (VP→mdThal). DS task sessions with optogenetic manipulations contained laser-paired as well as laser-unpaired trials to account for changes in baseline behavior within-subject over time. Lever choice and ICSS tasks included inactive operands to account for nonspecific behavioral interactions unrelated to laser delivery.
Viral approach
To target VP→VTA and VP→mdThal somas in a projection-specific manner, an intersectional dual-virus strategy was used.63 In each experiment, an AAV containing a Cre-dependent construct was injected into the VP and a retro-AAV expressing Cre recombinase was injected into the projection target region (VTA or mdThal), limiting cre-dependent expression specifically to VP neurons with terminals in the target region. GCaMP6f, an optical calcium sensor, was used as an indicator of neuronal activity in fiber photometry experiments. In optogenetic experiments, channelrhodopsin (ChR2), a light-sensitive cation channel was used for photostimulation.
Surgery
At least one week after arrival, rats were anesthetized using 4% isoflurane for stereotaxic surgery. Rats received preoperative subcutaneous injections of carprofen (5 mg/kg) for analgesia and cefazolin (75 mg/kg) to prevent infection. An incision was made to expose the skull, and craniotomies were drilled over the VP and either the VTA or mdThal. Viral injections for VP were aimed at 0.3 mm anteroposterior (AP), +/−2.3 mm mediolateral (ML), and −8.3mm anteroposterior (AP) relative to bregma. Viral injections for VTA were aimed at mm −5.8 AP, +/−0.7 mm ML and −8.0 mm DV relative to bregma. To target VP terminals in mdThal, while avoiding terminals in the lateral habenula, viral injections were aimed at −2.5 mm AP, 0 mm ML, and −6.0 mm DV. Rats used for RNAscope analysis (n = 5, all males) received unilateral infusions of AAV8 hSyn-DIO-mCherry (0.4uL, titer 1.1 × 10¹³ GC/mL, Addgene #50459) into the VP and retro-AAV Cre (0.4uL, titer ~1.03 × 10¹⁴ GC/mL, Addgene #51507) into the ipsilateral VTA at a rate of 0.1uL/min. Rats intended for fiber photometry experiments (n = 11, all females) received unilateral infusions of AAV9 FLEX-GCaMP6f (0.4uL, titer ~1.4 × 10¹³ GC/mL, Addgene #100833) into the VP and retro-AAV Cre (0.4uL, titer ~1.03 × 10¹⁴ GC/mL, Addgene #51507) into the ipsilateral VTA at a rate of 0.1uL/min. Rats intended for optogenetic experiments received AAV9 DO-hChR2-mCherry (0.4uL, titer ~3.1 × 10¹³ GC/m, Addgene # 20297) injected unilaterally into the VP and retro-AAV Cre (titer ~1.1 × 10¹³ GC/mL, Addgene #51507) injected into either the ipsilateral VTA (0.4uL, VP→VTA ChR2 group; n = 17, 8 females) or into the mdThal along the midline as indicated above (1.0uL, VP→mdThal ChR2 group; n = 22, 10 females) at a rate of 0.1uL/min. Optical fiber cannulae (0.48 NA, 400 μm from Doric for fiber photometry; 0.29 NA, 300 μm made in-house for optogenetics) were implanted over the VP of these rats and secured by four screws to the skull with dental cement (Jet). After each surgery, rats were monitored to ensure proper recovery, receiving at least three additional daily carprofen and cefazolin injections. Optogenetic manipulation rats recovered in their home cages at least one week post-surgery prior to additional handling, at least two weeks prior to behavioral training, and at least four weeks prior to optogenetic test sessions. Fiber photometry group rats recovered in their home cages at least one week post-surgery prior to additional handling and at least four weeks prior to behavioral training to allow sufficient time for GCaMP6f expression prior to recordings.
Discriminative stimulus task (DS task)
Rats underwent conditioning to learn a discriminative stimulus task within an operant chamber (Med Associates) as previously described.15,16,28 At random intervals, an auditory discriminative stimulus (DS) was presented, signaling availability of reward (0.2mL 10% weight/volume sucrose solution), contingent on port entry. To control for generalized effects of unexpected auditory stimuli, a neutral stimulus (NS) was also presented at semi-random intervals. The NS was never predictive of reward. To control for intrinsic motivational value of these auditory stimuli, the identities of the DS and NS (21khz siren noise or white noise) was counterbalanced between subjects. To promote quick and selective responding to the DS, rats were first trained with the DS alone and the duration of DS presentations was successively shortened. Starting with a 60s DS duration, the DS duration was reduced between sessions once rats met performance criteria (responding to at least 60% of DS cues) to 30s, then 20s, until it reached a final duration of 10s. Once rats responded at least 60% of the time to a 10s DS cue, the NS was introduced. Once rats met criteria for DS versus NS discrimination (responding to 60% of DS cues and no more than 40% of NS cues), a 1s reward delivery delay was added between port-entry and sucrose delivery in rats tested with fiber photometry to better dissociate photometry signals related to reward anticipation and consumption.
In vivo calcium recordings
Fiber photometry recordings and preprocessing
Rats were tethered to a fiber photometry system during training sessions by connecting their fiber optic cannulae to 300um core fiber optic patch cables (Doric) using bronze mating sleeves (Doric). The fiber photometry system consisted of excitation LEDs (465nm, 405nm; Doric), LED driver (ThorLabs) a filter cube (400–410nm isosbestic excitation filter; 460–490nm excitation filter; 500–550nm emission filter; Doric), amplifier (Doric), photometer (Doric; Newport), and data acquisition system (Tucker Davis Technologies RZ5P). Excitation LEDs were frequency-modulated (531 Hz for 465nm; 211 Hz for 405nm) and driven such that power measured at the fiber tip was ~30μW. Isosbestic and calcium-dependent signals were demodulated as previously described.62 LEDs were controlled and photometry signals were recorded using the Synapse software (Tucker Davis Technologies). Timestamps of behavioral events were also collected using TTL pulses from Med-PC (Med Associates). A 6th-order low-pass filter at 3Hz was applied to photometry signals at the time of collection. Following data acquisition, photometry signals were downsampled to 40Hz using custom MATLAB code. Baseline correction was done independently for the raw 465nm and 405nm signals using the adaptive iteratively reweighted Penalized Least Squares (airPLS) algorithm using default parameters (lambda = 10e7, order = 2, web = 0.1, p = 0.05, itermax = 20).60,64 The baseline-corrected 405nm was then linearly fit to the baseline-corrected 465nm signal as previously described.62 This fitted 405nm reference signal was then subtracted from the baseline-corrected 465nm to remove motion artifacts, yielding the final GCaMP6f signal. For trial-based analyses, recording sessions were divided into trials (n = 30 per cue type per session), with each cue onset initiating a new trial. Photometry signals were normalized by calculating a moving Z score on a trial-by-trial basis, using the mean and standard deviation of signal 10s prior to each cue onset as a baseline.
Fiber photometry analyses
Quantifying post-cue calcium dynamics throughout training
For each trial, we computed Z-scored GCaMP traces time-locked to cue onset. To quantitatively compare magnitude of traces, we computed an area-under-the-curve (AUC) of the GCaMP trace from event onset until 10s post-event onset. To examine the relationship between learning and VP→VTA activity, we examined a subset of four specific sessions for each subject: We examined a subset of four specific sessions for each subject: The first day of training with the DS alone, the day the NS was introduced, the day each rat met behavioral criteria for DS versus NS discrimination, and the final session after a 1s delay was introduced between DS port entries and reward delivery.
Isolating event-related calcium dynamics
For each trial, we computed Z-scored GCaMP traces time-locked to task events recorded during the trial (cue onset and first portentry). To visualize the temporal relationship between GCaMP dynamics and event timings on a trial-by-trial basis, we constructed peri-event heatplots of individual trials’ GCaMP activity and sorted trials by latency to port-entry. To evaluate the relationship between VP→VTA bulk calcium activity and DS task events, we ran an encoding model to generate event correlation ‘kernels’, or estimates of the temporal association between each event and the GCaMP signal. To dissociate the degree to which VP→VTA activity was related to cue presentation and/or animals’ reward seeking and consumption, we included DS onset and first port-entry events in our model. The encoding model analysis only included trials which had a 1.0s reward delivery delay between port-entry and sucrose delivery. Trials without recorded port-entries were not included in the model. Regression kernels for each behavioral event were computed using a linear encoding model as previously described in detail.32,33 Briefly, timestamps for each event type during each trial were binary coded. These event timestamps were used as fixed effects in a linear regression model, where the bulk photometry signal was equal to the linear sum of fluorescence evoked by each event. Timestamps for each event were shifted by one time bin (0.025s). The regression was recomputed using these shifted event timestamps. This was repeated such that each possible event time throughout the trial’s duration was represented (from −2s to +10s post-DS), generating a continuous kernel of regression coefficients for each event type. AUCs of each kernel were computed from 0s to +5s post-event.
Latency correlation analysis
Correlation coefficients between port-entry latency or licks per trial and photometry signals were computed on a trial-by-trial basis for each timestamp. Briefly, the photometry signals for each trial were time-locked to cue or port entry onset and converted to a Z score using 10s preceding cue onset as a baseline. For analysis of correlations between cue-evoked calcium activity and port entry latency, photometry signals following the first port entry timestamp during each trial were excluded to eliminate contamination from consumption-related fluorescence. The latency correlation analyses only included trials which had a 1.0s reward delivery delay between port-entry and sucrose delivery. Pearson correlations were then computed between the photometry signal and port-entry latency or lick per trial for each timestamp in the peri-cue time window. Correlation coefficients were averaged between all trials for each subject, then averaged between subjects to yield between-subject mean coefficients. To compare resulting coefficients against chance, we also ran a shuffled version of this correlation analysis in which port-entry latencies or licks per trial were shuffled randomly between trials prior to correlation and ran a linear mixed-effects model using coefficient as the response variable with fixed effects of shuffle and time bin along with a random intercept of subject.
In-vivo optogenetic manipulations
Optogenetic excitation during the DS task
Rats tested for the effects of optogenetic stimulation in the DS task were trained while connected via ceramic mating sleeves to 200 μm core patch cords, which were connected to a 473 nm DPSS laser via a fiber optic rotary joint mounted on a cantilever arm. After rats met training criteria in the DS task, we assessed the impact of activating VP→VTA or VP→mdThal neurons during DS presentations. To ensure rats discriminated between cues prior to optogenetic stimulation, rats were only included in analyses if they met performance criteria on the day prior to test day 1 (pre-test). Criteria was met when a rat’s port-entry probability on DS trials was least 60% and at least twice their port-entry probability on NS trials. On test day 1, rats received 1s of 20Hz stimulation (473 nm laser, 10–15 mW) during 50% of DS and NS presentations (randomly selected) at the start of the cue. On test day 2, rats received up to 10sof 20 Hz stimulation on 50% of cue presentations; this stimulation co-terminated with port-entry during the cue. We chose to optically stimulate at 20 Hz to emulate endogenous frequency of cue responses observed in prior electrophysiological recordings from the DS task.15–17
Choice task with optogenetic excitation
To assess whether activation of VP→VTA or VP→mdThal neurons during reward consumption would enhance the reward’s value and bias choice behavior, we trained rats in a choice task with optogenetic stimulation. During the task, rats were presented with two levers. Presses on either lever resulted in a 2s (.2mL) delivery of 10% sucrose to the reward port and retraction of the levers. Presses on one lever (the “stimulation” lever) also resulted in optogenetic stimulation paired with reward consumption, whereas the other lever did not produce any laser stimulation. Following presses on the stimulation lever, the first lick of 10% sucrose triggered 20 Hz stimulation (473 nm, 10–15 mW), which continued for up to 8s or until the rat stopped licking for at least 0.5s. The levers were reinserted 8s after reward consumption was initiated.
Intracranial self-stimulation (ICSS)
To assess whether activation of the VP→VTA pathway was rewarding on its own, as reported previously.7 we assessed optogenetic self-stimulation of this pathway in five 1-h sessions. During these sessions, entry into the “active” nosepoke resulted in 1s 20 Hz stimulation (473 nm laser, 10–15 mW) and simultaneous illumination of the nosepoke, whereas entry into the “inactive” nosepoke resulted in illumination of the nosepoke, but no optogenetic stimulation.
Histology
Validation of virus expression and fiber placement
Following the completion of behavioral testing, rats were anesthetized using pentobarbitol (390 mg/mL; Fatal-Plus) and transcardially perfused with cold 1x PBS and 4% PFA. Brains were extracted and post-fixed at 4C in 4% PFA overnight before being transferred to a 20% sucrose in 1x PBS solution for cryoprotection. Brains were left in sucrose solution until they sank completely (at least 48 h). 50um coronal sections were collected using a cryostat (Leica Biosystems). Sections were stored at 4C in 1x PBS before being mounted on glass slides using Vectashield antifade mounting medium with DAPI (Vector Laboratories). Images of sections were collected using a fluorescent microscope (Nikon TI-E Deconvolution Microscope) with a 4x objective and camera (ORCA Flash 4.0). Fiber positions and viral expression (GCaMP6f or ChR2-mCherry) within VP were confirmed by registering images with a reference atlas (Paxinos & Watson, 7th Edition) in ImageJ.58 Two animals from the photometry group were excluded from analysis due to insufficient GCaMP expression or loss of photometry signal during the experiment. Three animals from the VP→VTA ChR2 group and six animals from the VP→mdThal ChR2 group were excluded from analysis due to insufficient ChR2 expression or fiber implant placement outside of VP.
Cell-type analysis with RNAscope
Animals designated for RNAscope analysis (n = 5, all males) were deeply anesthetized with pentobarbital and decapitated. Fresh tissue was extracted and flash frozen in dry-ice-cooled isopentane. Brains were stored in a −80-degree Celsius freezer for up to 1 year. Tissue was stored until sectioning of tissue was done on the cryostat (coronal sections, 16 μm) and jump mounted for RNAScope processing. Tissue was processed to determine the location and extent of viral expression and neural identity of the neurons recorded. To validate our viral approach, we used RNAscope in situ hybridization with probes for Gad1, Slc17a6 (VGlut2) and mCherry (Figures 1A–1C). The channels were respectively: mCherry probe (555 nm excitation), glutamatergic probe (Slc17a6, 647 nm excitation), GABAergic probe (Gad1, 488 nm excitation). Imaging of the tissue was done on a confocal (Nikon AX R, UMN University Images Centers) at 20x with 6x digital zoom, and settings were optimized with the help of the University Imaging Centers at the University of Minnesota (UMN UIC). The exact same acquisition settings were used on all tissue samples. HALO software (Indica Labs) quantified the amount of cell specificity achieved from viral injections.34 Briefly, total cell number and location within an image was determined by nuclear staining (DAPI). Probes (Gad1, VGlut2, mCherry) are assigned their respective fluorophores within the software and the software compares the location of each fluorophore to the location of the DAPI labeled cells to confirm fluorophore expression is associated with a self-defined nuclei and cell size. HALO analysis software and software settings were optimized for the tissue from all animals and then settings were used to batch analyze cell counts of mCherry positive cells. The percentage and number of each defined cell identity of interest were determined for 1–2 sections per animal.
Optogenetic activation of VP→mdThal cFos
A subset of rats (n = 5) tested for the impact of VP→mdThal ChR2 activation on behavioral responding were subsequently assessed for the impact of laser stimulation on cFos to assess the efficacy of optogenetic activation in this neural population. Rats designated for laser stimulation (n = 3) received 15 rounds of 10s 20 Hz stimulation (473 nm, 10–15 mW), separated by 20s periods of no laser stimulation. Rats were perfused 60–90 min after the end of stimulation, or an equivalent waiting period in rats designated as controls (n = 2). Brains (1–3 slices per subject) were sliced at 50 μm and processed for cFos and mCherry. Sections were washed in PBS with bovine serum albumin and Triton (PBST) 3-times for 5 min, and incubated in 10% normal donkey serum in PBST for 60 min, before incubating in primary antibody (mouse anti-mCherry 1:1500 Living Colors 632543, RRID:AB_2307319; rabbit anti-cFos 1:6500 Synaptic Systems #226008, RRID: AB_2891278) in PBST overnight at 4C. Sections were then washed with PBST 3-times, and incubated for 2 h in secondary antibody in PBST (Alexa Fluor 555 donkey anti-mouse 1:500 Invitrogen #A-21570, RRID: AB_2536180; Alexa Fluor 488 donkey anti-rabbit 1:500 Invitrogen #A-21206, RRID:AB_2535792). Sections were then washed with PBS 3-times, mounted on coated glass slides in PBS, air-dried, and coverslipped with Vectashield mounting medium with DAPI. Imaging of the tissue was done on a confocal (Nikon AXR, UMN UIC) at 20x and settings were optimized with the help of the UMN UIC staff. For each rat the percentage of mCherry cells expressing cFos was manually quantified in 1–2 sections using the Cell Counter function in Fiji, with the testing condition masked. Per slice averages were calculated for each rat for statistical analysis.
QUANTIFICATION AND STATISTICAL ANALYSIS
Statistical analysis
Data were processed and analyzed using a combination of MATLAB, Python and R. We are limited in our ability to assess the potential influence of sex on these results as our photometry recordings were conducted only in female rats, and our optogenetic experiments were not sufficiently powered to assess the impact of sex as a biological factor. For statistical tests, we ran linear mixed-effects models using subject as a random intercept to account for variability between-subjects. Linear mixed effects models are generally robust to violations of distributional assumptions, which were not assessed here.65 We used a significance threshold (alpha) of p = 0.05 for statistical annotations in figures but reported exact p values throughout. All post-hoc pairwise comparisons were two-sided and p values were corrected for multiple comparisons using the Sidak method. Since post-hoc tests were based on linear mixed-effects models, degrees of freedom may be reported as a non-integer values. Statistical tests were performed in R using lmerTest and emmeans packages. To test the impact of cue type on VP→VTA activity throughout training, we ran a linear mixed-effects model using GCaMP AUC as the response variable with fixed effects of cue type and session along with a random intercept of subject. To test if the post-cue GCaMP AUCs were nonzero, we ran post-hoc one-sample T-tests comparing each post-cue GCaMP AUC to a null distribution centered at zero. To measure changes in the magnitude of post-cue VP→VTA activity across training, we ran posthoc pairwise comparisons between sessions for each cue-type. To determine if post-DS VP→VTA activity was contingent on reward seeking behavior, we assigned each DS trial a binary port entry outcome variable which reflected whether the animal made a port entry and earned a reward. We then ran a linear mixed-effects model using post-DS GCaMP AUC as the response variable with fixed effect of port entry outcome and random intercept of subject. To test if the post-cue GCaMP AUCs were nonzero, we ran post-hoc one-sample T-tests comparing each post-cue GCaMP AUC to a null distribution centered at zero. To statistically compare event kernels, we ran a linear mixed-effects model using kernel AUC as the response variable with fixed effects of event type along with a random intercept of subject. To test if the kernel AUCs were nonzero, we ran post-hoc one-sample T-tests comparing each kernel AUC to a null distribution centered at zero. To evaluate the encoding model’s accuracy, we ran a correlation between the true peri-DS GCaMP signal and the model’s predicted peri-DS GCaMP signal generated by event timings.
For the optogenetics experiments, VP→VTA and VP→mdThal groups were analyzed independently except for direct comparisons in the lever choice task and ICSS. In the DS task we assessed the impact of this stimulation on port entry latency and probability. We ran linear mixed-effects models for each test day (pre-test, 1s, or ≤10s stimulation) using port entry probability or port entry latency as the response variable with fixed effects of cue type and laser delivery with a random intercept of subject. To assess the impact of optogenetic activation we assessed the total number of presses on each lever, the proportion of presses on the stimulation lever, as well as licks per reward with and without stimulation. Licks per reward were only calculated and included in analyses from sessions where rats completed at least 3 lever presses of each type to ensure that both were sampled sufficiently for comparisons. We ran a linear mixed-effects model using lever press count or licks per reward as the response variable with fixed effects of lever type and session with a random intercept of subject. We also ran a linear mixed-effects model using proportion of active lever presses as the response variable with a fixed effect of session and random intercept of subject. To compare these proportions against chance, we ran post-hoc one-sample T-tests comparing each session’s active proportion to a null distribution centered at 0.5. To assess the impact of optogenetic activation on ICSS assessed the total number of entries into each nosepoke and the proportion of active nosepokes with and without stimulation. We ran linear mixed-effects models using nosepoke count as the response variable with fixed effects of nosepoke type and session with a random intercept of subject. We also ran a linear mixed-effects model using proportion of active nosepokes as the response variable with a fixed effect of session and random intercept of subject. To compare these proportions against chance, we ran post-hoc one-sample T-tests comparing each session’s active proportion to a null distribution centered at 0.5. Statistical analyses are reported in the Results section and in the Figure Legends. The number of rats (n-values) in each experiment is reported in the Figure Legends.
Supplementary Material
Highlights.
Cued reward seeking activates calcium in VTA-projecting ventral pallidum neurons
Calcium activity more strongly reflects reward seeking and consumption than cues
Optogenetic stimulation during the cue does not alter cued reward seeking
Stimulation during reward consumption can bias choice behavior
ACKNOWLEDGMENTS
This work was supported in part by National Institutes of Health grant R01DA053208 to J.M.R. and NRSA F31DA055442 to D.P.
Footnotes
DECLARATION OF INTERESTS
The authors declare no competing interests.
SUPPLEMENTAL INFORMATION
Supplemental information can be found online at https://doi.org/10.1016/j.celrep.2023.113669.
REFERENCES
- 1.Robinson TE, and Berridge KC (2000). The psychology and neurobiology of addiction: an incentive-sensitization view. Addiction 95, 91–117. [DOI] [PubMed] [Google Scholar]
- 2.Ferguson SG, and Shiffman S (2009). The relevance and treatment of cue-induced cravings in tobacco dependence. J. Subst. Abuse Treat. 36, 235–243. [DOI] [PubMed] [Google Scholar]
- 3.Preston KL, Kowalczyk WJ, Phillips KA, Jobes ML, Vahabzadeh M, Lin J-L, Mezghanni M, and Epstein DH (2018). Exacerbated Craving in the Presence of Stress and Drug Cues in Drug-Dependent Patients. Neuropsychopharmacol 43, 859–867. [DOI] [PMC free article] [PubMed] [Google Scholar]
- 4.Smith KS, Tindell AJ, Aldridge JW, and Berridge KC (2009). Ventral pallidum roles in reward and motivation. Behav. Brain Res. 196, 155–167. [DOI] [PMC free article] [PubMed] [Google Scholar]
- 5.Root DH, Melendez RI, Zaborszky L, and Napier TC (2015). The ventral pallidum: Subregion-specific functional anatomy and roles in motivated behaviors. Prog. Neurobiol. 130, 29–70. [DOI] [PMC free article] [PubMed] [Google Scholar]
- 6.Soares-Cunha C, and Heinsbroek JA (2023). Ventral pallidal regulation of motivated behaviors and reinforcement. Front. Neural Circuits 17, 1086053. [DOI] [PMC free article] [PubMed] [Google Scholar]
- 7.Faget L, Zell V, Souter E, McPherson A, Ressler R, Gutierrez-Reed N, Yoo JH, Dulcis D, and Hnasko TS (2018). Opponent control of behavioral reinforcement by inhibitory and excitatory projections from the ventral pallidum. Nat. Commun. 9, 849. [DOI] [PMC free article] [PubMed] [Google Scholar]
- 8.Stephenson-Jones M, Bravo-Rivera C, Ahrens S, Furlan A, Xiao X, Fernandes-Henriques C, and Li B (2020). Opposing Contributions of GABAergic and Glutamatergic Ventral Pallidal Neurons to Motivational Behaviors. Neuron 105, 921–933.e5. [DOI] [PMC free article] [PubMed] [Google Scholar]
- 9.Heinsbroek JA, Bobadilla A-C, Dereschewitz E, Assali A, Chalhoub RM, Cowan CW, and Kalivas PW (2020). Opposing Regulation of Cocaine Seeking by Glutamate and GABA Neurons in the Ventral Pallidum. Cell Rep. 30, 2018–2027.e3. [DOI] [PMC free article] [PubMed] [Google Scholar]
- 10.Prasad AA, Xie C, Chaichim C, Nguyen JH, McClusky HE, Killcross S, Power JM, and McNally GP (2020). Complementary Roles for Ventral Pallidum Cell Types and Their Projections in Relapse. J. Neurosci. 40, 880–893. [DOI] [PMC free article] [PubMed] [Google Scholar]
- 11.Knowland D, Lilascharoen V, Pacia CP, Shin S, Wang EH-J, and Lim BK (2017). Distinct Ventral Pallidal Neural Populations Mediate Separate Symptoms of Depression. Cell 170, 284–297.e18. [DOI] [PMC free article] [PubMed] [Google Scholar]
- 12.Mahler SV, Vazey EM, Beckley JT, Keistler CR, McGlinchey EM, Kaufling J, Wilson SP, Deisseroth K, Woodward JJ, and Aston-Jones G (2014). Designer receptors show role for ventral pallidum input to ventral tegmental area in cocaine seeking. Nat. Neurosci. 17, 577–585. [DOI] [PMC free article] [PubMed] [Google Scholar]
- 13.Mahler SV, and Aston-Jones GS (2012). Fos Activation of Selective Afferents to Ventral Tegmental Area during Cue-Induced Reinstatement of Cocaine Seeking in Rats. J. Neurosci. 32, 13309–13326. [DOI] [PMC free article] [PubMed] [Google Scholar]
- 14.Prasad AA, and McNally GP (2016). Ventral Pallidum Output Pathways in Context-Induced Reinstatement of Alcohol Seeking. J. Neurosci. 36, 11716–11726. [DOI] [PMC free article] [PubMed] [Google Scholar]
- 15.Richard JM, Ambroggi F, Janak PH, and Fields HL (2016). Ventral Pallidum Neurons Encode Incentive Value and Promote Cue-Elicited Instrumental Actions. Neuron 90, 1165–1173. [DOI] [PMC free article] [PubMed] [Google Scholar]
- 16.Richard JM, Stout N, Acs D, and Janak PH (2018). Ventral pallidal encoding of reward-seeking behavior depends on the underlying associative structure. Elife 7, e33107. [DOI] [PMC free article] [PubMed] [Google Scholar]
- 17.Lederman J, Lardeux S, and Nicola SM (2021). Vigor encoding in the ventral pallidum. eNeuro 8. ENEURO.0064–21.2021. [DOI] [PMC free article] [PubMed] [Google Scholar]
- 18.Yun IA, Wakabayashi KT, Fields HL, and Nicola SM (2004). The Ventral Tegmental Area Is Required for the Behavioral and Nucleus Accumbens Neuronal Firing Responses to Incentive Cues. J. Neurosci. 24, 2923–2933. [DOI] [PMC free article] [PubMed] [Google Scholar]
- 19.Fischbach-Weiss S, Reese RM, and Janak PH (2018). Inhibiting Mesolimbic Dopamine Neurons Reduces the Initiation and Maintenance of Instrumental Responding. Neuroscience 372, 306–315. [DOI] [PMC free article] [PubMed] [Google Scholar]
- 20.Tian J, Huang R, Cohen JY, Osakada F, Kobak D, Machens CK, Callaway EM, Uchida N, and Watabe-Uchida M (2016). Distributed and Mixed Information in Monosynaptic Inputs to Dopamine Neurons. Neuron 91, 1374–1389. [DOI] [PMC free article] [PubMed] [Google Scholar]
- 21.Ottenheimer DJ, Bari BA, Sutlief E, Fraser KM, Kim TH, Richard JM, Cohen JY, and Janak PH (2020). A quantitative reward prediction error signal in the ventral pallidum. Nat. Neurosci. 23, 1267–1276. [DOI] [PMC free article] [PubMed] [Google Scholar]
- 22.Arsenault JT, Rima S, Stemmann H, and Vanduffel W (2014). Role of the Primate Ventral Tegmental Area in Reinforcement and Motivation. Curr. Biol. 24, 1347–1353. [DOI] [PMC free article] [PubMed] [Google Scholar]
- 23.Watabe-Uchida M, Eshel N, and Uchida N (2017). Neural Circuitry of Reward Prediction Error. Annu. Rev. Neurosci. 40, 373–394. [DOI] [PMC free article] [PubMed] [Google Scholar]
- 24.Lerner TN, Holloway AL, and Seiler JL (2021). Dopamine, Updated: Reward Prediction Error and Beyond. Curr. Opin. Neurobiol. 67, 123–130. [DOI] [PMC free article] [PubMed] [Google Scholar]
- 25.Namba MD, Tomek SE, Olive MF, Beckmann JS, and Gipson CD (2018). The Winding Road to Relapse: Forging a New Understanding of Cue-Induced Reinstatement Models and Their Associated Neural Mechanisms. Front. Behav. Neurosci. 12, 17. [DOI] [PMC free article] [PubMed] [Google Scholar]
- 26.Lay BPP, and Khoo SY-S (2021). Associative processes in addiction relapse models: A review of their Pavlovian and instrumental mechanisms, history, and terminologynab 3, p. e18. [Google Scholar]
- 27.Troisi JR, 2nd. (2013). Perhaps More Consideration of Pavlovian-Operant Interaction May Improve the Clinical Efficacy of Behaviorally Based Drug Treatment Programs. TPR 63, 863–894. [DOI] [PMC free article] [PubMed] [Google Scholar]
- 28.Nicola SM, Yun IA, Wakabayashi KT, and Fields HL (2004). Cue-Evoked Firing of Nucleus Accumbens Neurons Encodes Motivational Significance During a Discriminative Stimulus Task. J. Neurophysiol. 91, 1840–1865. [DOI] [PubMed] [Google Scholar]
- 29.Young WS, Alheid GF, and Heimer L (1984). The ventral pallidal projection to the mediodorsal thalamus: a study with fluorescent retrograde tracers and immunohistofluorescence. J. Neurosci. 4, 1626–1638. [DOI] [PMC free article] [PubMed] [Google Scholar]
- 30.Engeln M, Fox ME, Chandra R, Choi EY, Nam H, Qadir H, Thomas SS, Rhodes VM, Turner MD, Herman RJ, et al. (2022). Transcriptome profiling of the ventral pallidum reveals a role for pallidothalamic neurons in cocaine reward. Mol. Psychiatry 27, 3980–3991. [DOI] [PMC free article] [PubMed] [Google Scholar]
- 31.Leung BK, and Balleine BW (2015). Ventral Pallidal Projections to Mediodorsal Thalamus and Ventral Tegmental Area Play Distinct Roles in Outcome-Specific Pavlovian-Instrumental Transfer. J. Neurosci. 35, 4953–4964. [DOI] [PMC free article] [PubMed] [Google Scholar]
- 32.Parker NF, Cameron CM, Taliaferro JP, Lee J, Choi JY, Davidson TJ, Daw ND, and Witten IB (2016). Reward and choice encoding in terminals of midbrain dopamine neurons depends on striatal target. Nat. Neurosci. 19, 845–854. [DOI] [PMC free article] [PubMed] [Google Scholar]
- 33.Parker NF, Baidya A, Cox J, Haetzel L, Zhukovskaya A, Murugan M, Engelhard B, Goldman MS, and Witten IB (2019). Choice-selective sequences dominate in cortical relative to thalamic inputs to nucleus accumbens, providing a potential substrate for credit assignment. Neuroscience). [DOI] [PMC free article] [PubMed] [Google Scholar]
- 34.Scott A, Palmer D, Newell B, Lin I, Cayton CA, Paulson A, Remde P, and Richard JM (2023). Ventral Pallidal GABAergic Neuron Calcium Activity Encodes Cue-Driven Reward Seeking and Persists in the Absence of Reward Delivery. J. Neurosci. 43, 5191–5203. [DOI] [PMC free article] [PubMed] [Google Scholar]
- 35.Spector AC, and St. John SJ. (1998). Role of taste in the microstructure of quinine ingestion by rats. Am. J. Physiol. 274, R1687–R1703. [DOI] [PubMed] [Google Scholar]
- 36.Wassum KM, Ostlund SB, Maidment NT, and Balleine BW (2009). Distinct opioid circuits determine the palatability and the desirability of rewarding events. Proc. Natl. Acad. Sci. USA 106, 12512–12517. [DOI] [PMC free article] [PubMed] [Google Scholar]
- 37.Katsuura Y, Heckmann JA, and Taha SA (2011). μ-Opioid receptor stimulation in the nucleus accumbens elevates fatty tastant intake by increasing palatability and suppressing satiety signals. Am. J. Physiol. Regul. Integr. Comp. Physiol. 301, R244–R254. [DOI] [PMC free article] [PubMed] [Google Scholar]
- 38.Dwyer DM (2012). Licking and Liking: The Assessment of Hedonic Responses in Rodents. Q. J. Exp. Psychol. 65, 371–394. [DOI] [PubMed] [Google Scholar]
- 39.Riordan JE, and Dwyer DM (2019). Licking microstructure and hedonic changes after flavour preference learning in rats. Q. J. Exp. Psychol. 72, 2717–2725. [DOI] [PubMed] [Google Scholar]
- 40.Legaria AA, Yang B, Ahanonu B, Licholai JA, Parker JG, and Kravitz AV (2021). Striatal fiber photometry reflects primarily non-somatic activity. Preprint at bioRxiv. [DOI] [PMC free article] [PubMed] [Google Scholar]
- 41.Ahrens AM, Meyer PJ, Ferguson LM, Robinson TE, and Aldridge JW (2016). Neural Activity in the Ventral Pallidum Encodes Variation in the Incentive Value of a Reward Cue. J. Neurosci. 36, 7957–7970. [DOI] [PMC free article] [PubMed] [Google Scholar]
- 42.Berridge KC, and Aldridge JW (2014). Decision utility, incentive salience, and cue-triggered ‘‘wanting.’’28. [PMC free article] [PubMed] [Google Scholar]
- 43.Koob GF, and Volkow ND (2016). Neurobiology of addiction: a neurocircuitry analysis. Lancet Psychiatr. 3, 760–773. [DOI] [PMC free article] [PubMed] [Google Scholar]
- 44.Volkow ND, Wise RA, and Baler R (2017). The dopamine motive system: implications for drug and food addiction. Nat. Rev. Neurosci. 18, 741–752. [DOI] [PubMed] [Google Scholar]
- 45.Meyer PJ, Lovic V, Saunders BT, Yager LM, Flagel SB, Morrow JD, and Robinson TE (2012). Quantifying Individual Variation in the Propensity to Attribute Incentive Salience to Reward Cues. PLoS One 7, e38987. [DOI] [PMC free article] [PubMed] [Google Scholar]
- 46.Meyer PJ, Cogan ES, and Robinson TE (2014). The Form of a Conditioned Stimulus Can Influence the Degree to Which It Acquires Incentive Motivational Properties. PLoS One 9, e98163. [DOI] [PMC free article] [PubMed] [Google Scholar]
- 47.Hjelmstad GO, Xia Y, Margolis EB, and Fields HL (2013). Opioid Modulation of Ventral Pallidal Afferents to Ventral Tegmental Area Neurons. J. Neurosci. 33, 6454–6459. [DOI] [PMC free article] [PubMed] [Google Scholar]
- 48.Morales M, and Margolis EB (2017). Ventral tegmental area: cellular heterogeneity, connectivity and behaviour. Nat. Rev. Neurosci. 18, 73–85. [DOI] [PubMed] [Google Scholar]
- 49.Zhou W-L, Kim K, Ali F, Pittenger ST, Calarco CA, Mineur YS, Ramakrishnan C, Deisseroth K, Kwan AC, and Picciotto MR (2022). Activity of a direct VTA to ventral pallidum GABA pathway encodes unconditioned reward value and sustains motivation for reward. Sci. Adv. 8, eabm5217. [DOI] [PMC free article] [PubMed] [Google Scholar]
- 50.Vachez YM, Tooley JR, Abiraman K, Matikainen-Ankney B, Casey E, Earnest T, Ramos LM, Silberberg H, Godynyuk E, Uddin O, et al. (2021). Ventral arkypallidal neurons inhibit accumbal firing to promote reward consumption. Nat. Neurosci. 24, 379–390. [DOI] [PMC free article] [PubMed] [Google Scholar]
- 51.Ottenheimer DJ, Wang K, Haimbaugh A, Janak PH, and Richard JM (2019). Recruitment and disruption of ventral pallidal cue encoding during alcohol seeking. Eur. J. Neurosci. 50, 3428–3444. [DOI] [PMC free article] [PubMed] [Google Scholar]
- 52.Haber SN (2017). Chapter 1 - Anatomy and Connectivity of the Reward Circuit. In Decision Neuroscience, Dreher J-C and Tremblay L, eds. (Academic Press; ), pp. 3–19. [Google Scholar]
- 53.Mitchell AS, and Chakraborty S (2013). What does the mediodorsal thalamus do? Front. Syst. Neurosci. 7, 37. [DOI] [PMC free article] [PubMed] [Google Scholar]
- 54.Tripathi A, Prensa L, and Mengual E (2013). Axonal branching patterns of ventral pallidal neurons in the rat. Brain Struct. Funct. 218, 1133–1157. [DOI] [PubMed] [Google Scholar]
- 55.Feng Q, An S, Wang R, Lin R, Li A, Gong H, and Luo M (2021). Whole-Brain Reconstruction of Neurons in the Ventral Pallidum Reveals Diverse Projection Patterns. Front. Neuroanat. 15, 801354. [DOI] [PMC free article] [PubMed] [Google Scholar]
- 56.Madisen L, Garner AR, Shimaoka D, Chuong AS, Klapoetke NC, Li L, van der Bourg A, Niino Y, Egolf L, Monetti C, et al. (2015). Transgenic mice for intersectional targeting of neural sensors and effectors with high specificity and performance. Neuron 85, 942–958. [DOI] [PMC free article] [PubMed] [Google Scholar]
- 57.Chen T-W, Wardill TJ, Sun Y, Pulver SR, Renninger SL, Baohan A, Schreiter ER, Kerr RA, Orger MB, Jayaraman V, et al. (2013). Ultrasensitive fluorescent proteins for imaging neuronal activity. Nature 499, 295–300. [DOI] [PMC free article] [PubMed] [Google Scholar]
- 58.Schneider CA, Rasband WS, and Eliceiri KW (2012). NIH Image to ImageJ: 25 years of image analysis. Nat. Methods 9, 671–675. [DOI] [PMC free article] [PubMed] [Google Scholar]
- 59.Parker NF, Baidya A, Cox J, Haetzel LM, Zhukovskaya A, Murugan M, Engelhard B, Goldman MS, and Witten IB (2022). Choice-selective sequences dominate in cortical relative to thalamic inputs to NAc to support reinforcement learning. Cell Rep. 39, 110756. [DOI] [PMC free article] [PubMed] [Google Scholar]
- 60.Zhang Z-M, Chen S, and Liang Y-Z (2010). Baseline correction using adaptive iteratively reweighted penalized least squares. Analyst 135, 1138–1146. [DOI] [PubMed] [Google Scholar]
- 61.Morel P (2018). Gramm: grammar of graphics plotting in Matlab. J. Open Source Softw. 3, 568. [Google Scholar]
- 62.Zalocusky KA, Ramakrishnan C, Lerner TN, Davidson TJ, Knutson B, and Deisseroth K (2016). Nucleus accumbens D2R cells signal prior outcomes and control risky decision-making. Nature 531, 642–646. [DOI] [PMC free article] [PubMed] [Google Scholar]
- 63.Tervo DGR, Hwang B-Y, Viswanathan S, Gaj T, Lavzin M, Ritola KD, Lindo S, Michael S, Kuleshova E, Ojala D, et al. (2016). A Designer AAV Variant Permits Efficient Retrograde Access to Projection Neurons. Neuron 92, 372–382. [DOI] [PMC free article] [PubMed] [Google Scholar]
- 64.Martianova E, Aronson S, and Proulx CD (2019). Multi-Fiber Photometry to Record Neural Activity in Freely-Moving Animals. JoVE, 60278. [DOI] [PubMed] [Google Scholar]
- 65.Schielzeth H, Dingemanse NJ, Nakagawa S, Westneat DF, Allegue H, Teplitsky C, Réale D, Dochtermann NA, Garamszegi LZ, and Araya-Ajoy YG (2020). Robustness of linear mixed-effects models to violations of distributional assumptions. Methods Ecol. Evol. 11, 1141–1152. [Google Scholar]
Associated Data
This section collects any data citations, data availability statements, or supplementary materials included in this article.
Supplementary Materials
Data Availability Statement
All data reported in this paper will be shared by the lead contact upon request. Processed data for statistical analysis is available in an online repository and is publicly available as of the date of acceptance for publication. The DOI is listed in the key resources table.
All original analysis code has been deposited and made publicly available as of the date of acceptance for publication. DOIs are listed in the key resources table.
Any additional information required to reanalyze the data reported in this paper is available from the lead contact upon request.
KEY RESOURCES TABLE.
| REAGENT or RESOURCE | SOURCE | IDENTIFIER |
|---|---|---|
|
| ||
| Antibodies | ||
|
| ||
| Mouse anti-mCherry | Living Colors | 632543; RRID:AB_2307319 |
| Rabbit anti-cFos | Synaptic Systems | 226 008; RRID:AB_2891278 |
| Alexa 555 Donkey anti-mouse | Invitrogen | A-31570; RRID: AB_2536180 |
| Alexa 488 Donkey anti-rabbit | Invitrogen | A-21206; RRID:AB_2535792 |
|
| ||
| Bacterial and virus strains | ||
|
| ||
| AAVrg- pmSyn1-EBFP-Cre | Hongkui Zeng (Madisen et al.)56 | Addgene 51507-AAVrg |
| AAV9-EF1a-double floxed-hChR2(H132R)-mCherry-WPRE-HGHpa | Karl Deisseroth | Addgene 20297-AAV9 |
| AAV9-hSyn-Flex GCaMP6f-WPRE-SV40 | Douglas Kim and GENIE Project (Chen et al.)57 | Addgene 100833-AAV9 |
| AAV8-hSyn-DIO mCherry | Bryan Roth | Addgene 50459-AAV8 |
|
| ||
| Chemicals, peptides, and recombinant proteins | ||
|
| ||
| Carprofen injectable solution | Santa Cruz Biotechnology, Inc. | sc-395914Rx |
| Vectashield mounting medium | VectorLabs | H-1000-10 |
| Jet liquid clear | Lang Dental | N/A |
| Jet denture repair powder | Lang Dental | N/A |
|
| ||
| Critical commercial assays | ||
|
| ||
| RNAscope Multiplex Fluorescent Reagent Kit v2 | ACDBio | 323270 |
| RNAscope mCherry probe | ACDBio | 431201 |
| RNAscope Rn-Slc17a6-C2 probe | ACDBio | 317011-C2 |
| RNAscope Rn-Gad1-C3 probe | ACDBio | 316401-C3 |
|
| ||
| Deposited data | ||
|
| ||
| Processed data for statistical analysis | Current paper | https://doi.org/10.5281/zenodo.10059759 |
|
| ||
| Experimental models: Organisms/strains | ||
|
| ||
| Long Evans (Blue Spruce) outbred rats | Envigo/Inotiv | HsdBlu:LE |
|
| ||
| Software and algorithms | ||
|
| ||
| MATLAB | Mathworks | RRID:SCR_001622 |
| R | The R Project | https://cran.r-project.org/mirrors.html |
| Python | Python | https://www.python.org/downloads/ |
| Synapse software | Tucker-Davis Technologies | https://www.tdt.com/component/synapse-software/ |
| HALO Image Analysis Platform | Indica Labs | RRID:SCR_018350 |
| ImageJ | Schneider et al.58 | https://ImageJ.net/ij/download.html |
| Behavioral event encoding model | Parker et al.59 | https://github.com/nfparker/event_encoding_model |
| airPLS algorithm | Zhang et al.60 | https://github.com/zmzhang/airPLS |
| Fiber photometry analysis code | Current paper | https://doi.org/10.5281/zenodo.10366545 |
| Optogenetics analysis code | Current paper | https://doi.org/10.5281/zenodo.10366408 |
| Statistical analysis code | Current paper | https://doi.org/10.5281/zenodo.10059759 |
| Gramm | Morel61 | https://github.com/piermorel/gramm |
|
| ||
| Other | ||
|
| ||
| Fiberoptic cannula for optogenetics | RWD Life Science Inc. | R-FOC-BF300C39NA |
| Fiberoptic cannula for fiber photometry | Doric Lenses | MFC_300/330–0.37_9mm_MF2.5_FLT |
| Mono fiberoptic patchcords | Doric Lenses | MFP_400/460/900–0.48_1m_FCM-MF1.25 |
| Fiber photometry workstations | Tucker-Davis Technologies | RZ5P |
| Newport photoreceivers | Doric Lenses | NPM_2151_FOA_FC |
| Fluorescence Minicubes | Doric Lenses | FMC4_AE(405)_E(460–490)_F(500–550)_S |
| LED driver | Thor Labs | DC4104 |
| Connectorized LD: 405 nm | Doric Lenses | CLED_405 |
| Connectorized LD: 465 nm | Doric Lenses | CLED_465 |
| Confocal microscope | Nikon | AX R |
| Deconvolution microscope | Nikon | Ti-E |
| Dual small animal stereotaxic instrument | David Kopf Instrumental | Model 942 |
| Cryostat | Leica Biosystems | CM1900 |