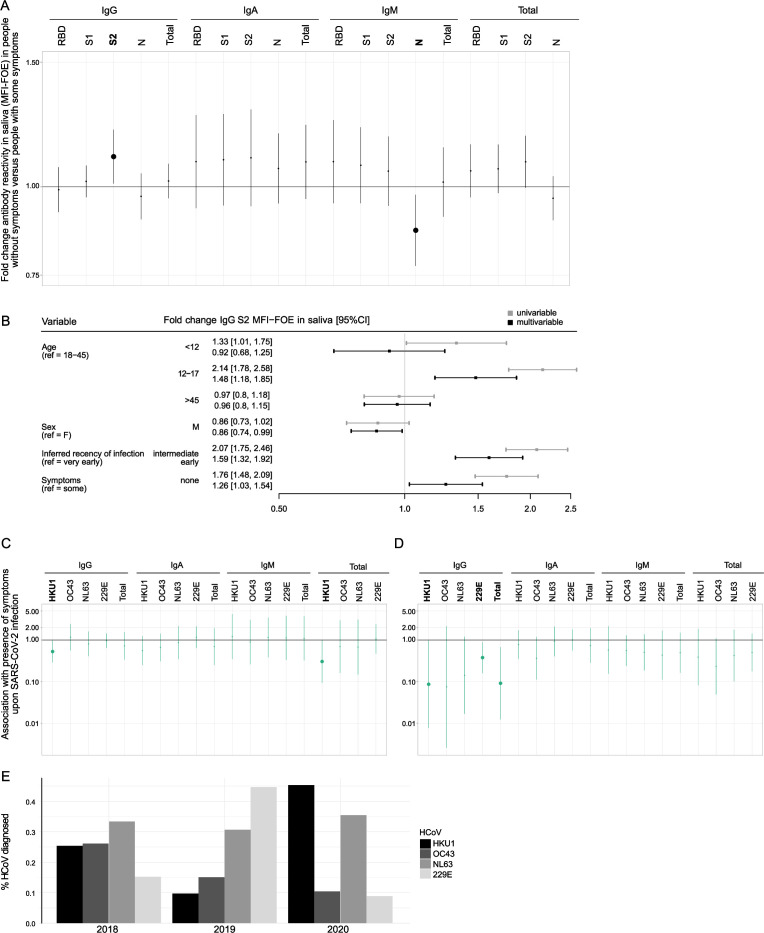
Fig 6.
Cross-protective effect of HCoV immunity on symptoms. (A) Linear regression models (n = 219) adjusted on age, sex, and inferred recency of infection to assess the fold change in antibody reactivities in saliva (MFI-FOE) in individuals without symptoms versus individuals with symptoms. Binding activities with significant difference (P < 0.05) between those with and without symptoms are indicated in bold. Solid line indicates the fold change obtained from the linear regression model, and shaded areas correspond to the 95% confidence intervals. (B) Coefficient plot showing association of symptom development with mucosal IgG S2 antibody levels in univariable (gray) and multivariable (black) linear regression models adjusted on other covariables (age, sex, and inferred recency of infection). (C and D) Logistic regressions adjusted on age, sex, and inferred recency of infection (B2, 0–1 month or C3, 1–4 months) to assess association between symptom development upon SARS-CoV-2 infection and all pre-infection HCoV antibody titers in plasma (n = 215) (C) and saliva (n = 219) (D). Solid line indicates odds ratio estimation and shaded areas correspond to the 95% confidence intervals. Binding activities significantly associated with symptom development (P < 0.05) are indicated in bold. (E) Bar graph depicting prevalence of each HCoV among all HCoV cases diagnosed in 2018–2020 from the virus diagnostics unit at the University of Zurich.

