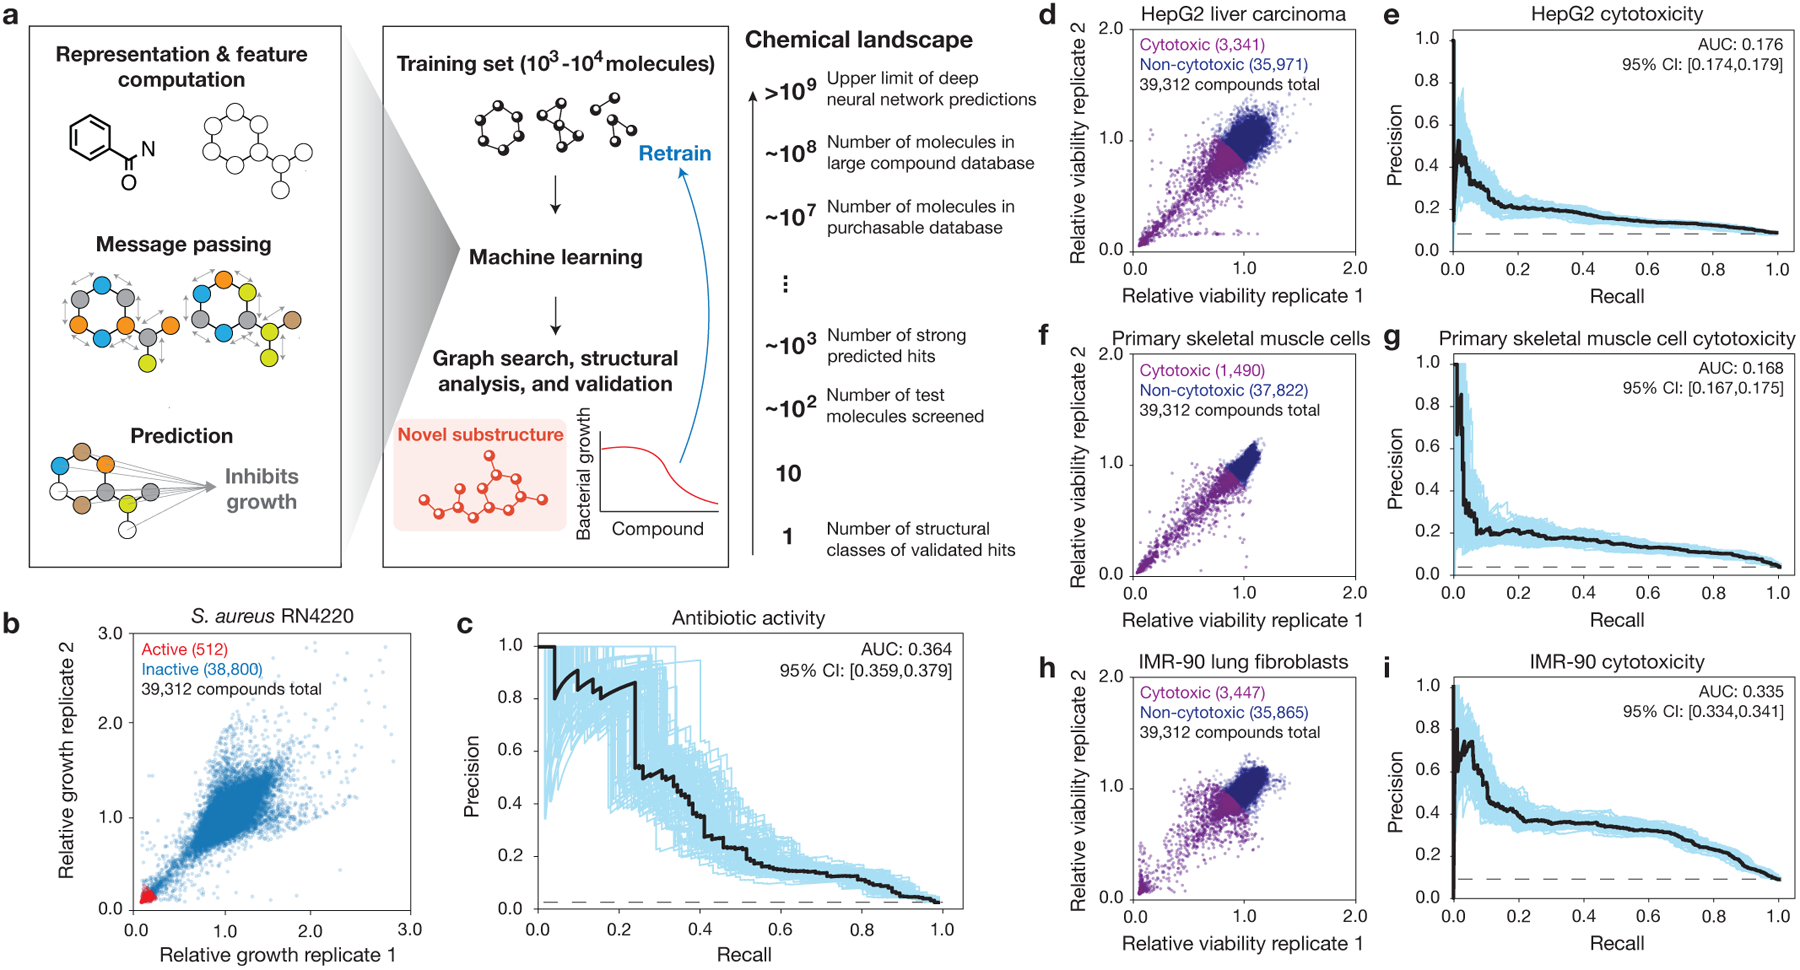
Fig. 1. Ensembles of deep learning models for predicting antibiotic activity and human cell cytotoxicity.

a, Schematic of the approach. Graph neural networks predict the chemical properties of >109 molecules in silico, in contrast to expensive and time-consuming experimental screening of large chemical libraries. Here, the growth inhibition activities of 39,312 chemically diverse compounds are used to train the model, the model is applied to virtual chemical databases comprising 12,076,365 molecules that can be readily procured, and compounds with high prediction scores (“hits”) are analyzed according to structural class, procured, and tested. This approach can be iterated, and the model can be retrained to generate new predictions.
b, S. aureus RN4220 growth inhibition data for a screen of 39,312 compounds at a final concentration of 50 μM. Data are from two biological replicates. Active compounds are those for which the mean relative growth is <0.2.
c, Precision-recall curves for an ensemble of 10 Chemprop models, augmented with RDKit features, trained and tested on the data in (b). The black dashed line represents the baseline fraction of active compounds in the dataset (1.3%). Blue curves and the 95% confidence interval (CI) indicate variation from bootstrapping. AUC, area under the curve.
d, f, h, HepG2 (d), HSkMC (f), and IMR-90 (h) viability data for screens of 39,312 compounds at a final concentration of 10 μM. Data are from two biological replicates for each cell type. Cytotoxic compounds are those for which the mean relative viability is <0.9.
e, g, i, Precision-recall curves for an ensemble of 10 Chemprop models, augmented with RDKit features, trained and tested on the data in (d,f,h). Black dashed lines represent the baseline fractions of cytotoxic compounds in the datasets (e, 8.5%; g, 3.8%; i, 8.8%). Blue curves and the 95% confidence interval (CI) indicate variation from bootstrapping.
