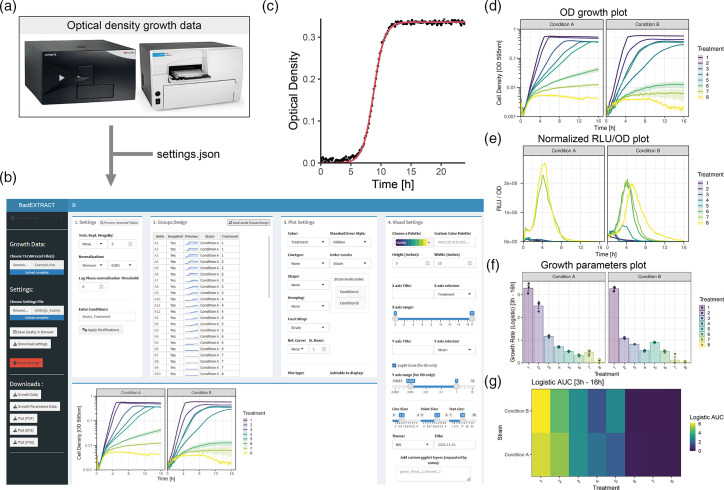
Fig. 1.
BactEXTRACT R Shiny application. (a) Raw data from common plate readers and simple text files can be input into the software. Multiple files can be uploaded at the same time. (b) The web interface of BactEXTRACT allows for the quick editing of any parameters and customized theming. (c) BactEXTRACT fits a logistic curve to every sample. Different graphical layers such as colour, shape, linetype and facet can be chosen to allow for clear separation of all groups present in the data. (d) Standard OD growth plots on logarithmic or linear axes can be plotted. (e) Luminescence and fluorescence sub-tables (if any) can be selected and plotted as well, either normalized by OD or as a standalone plot. (f, g) Each growth parameter output from the logistic fitting can be plotted as either a bar plot (f) or as a checkerboard plot, which is particularly handy when combinations of antimicrobial compounds are being tested (g).

