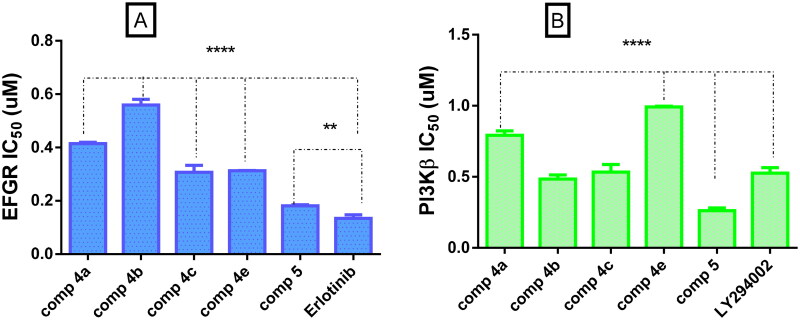
Figure 4.
(A) Graphical representation for comparison of IC50 EGFR (µM) of compounds 4a–c, 4e, 5, and erlotinib, (B) graphical representation for comparison of IC50 PI3Kβ (µM) of compounds 4a–c, 4e, 5 LY294002. Both enzymes were performed using four-dose protocol. The data are expressed as mean ± SD (n = 3 experiments), statistical analysis was performed by two-way ANOVA followed by Tukey’s post hoc test with *significant at p > 0.05, **significant at p > 0.01, ***significant at p > 0.001, and ****significant at p > 0.0001 and nsno significance.

