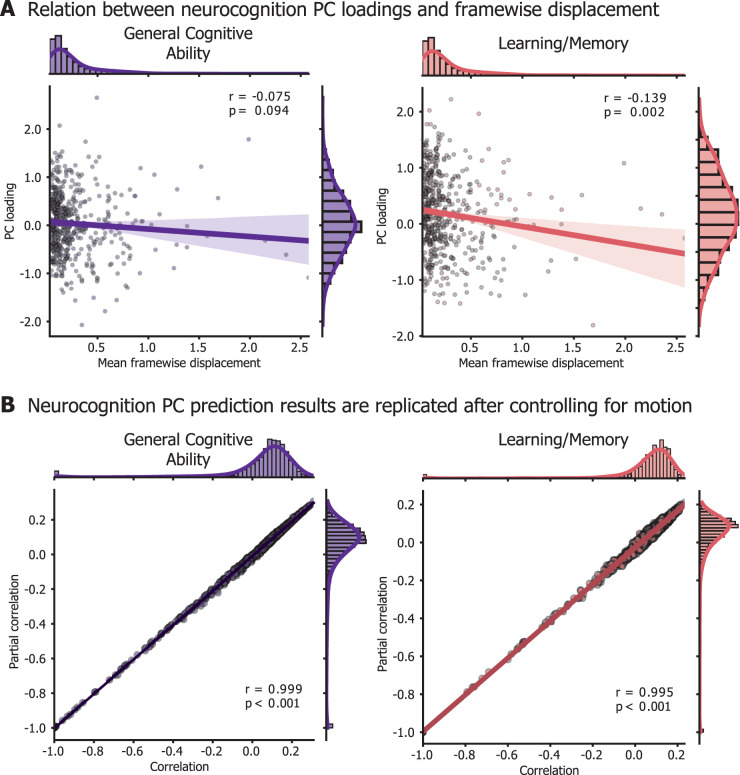
Figure 8.
Replication of prediction results after controlling for head movement. A, Participants’ loadings onto the neurocognition PCs are mildly anti-correlated with mean FD. Each participant included in the neurocognition PC analysis (502 with complete data) is represented as a point in the scatterplots. B, To account for the relationship between head movement and cognitive scores, we replicated the prediction analysis controlling for mean FD. After getting predicted scores for each participant with leave-one-out cross validation, we then either computed Pearson's correlation between model predictions and true scores (“correlation” on the x-axis) or a partial correlation, including FD as a covariate (“Partial correlation” on the y-axis). Prediction results are replicated after controlling for movement. Note that in main analysis (Fig. 7), the prediction results (without the additional control for movement) are presented as adjusted R2, but for equal comparison with the partial correlation, we present prediction results as a Pearson's correlation, prior to the adjusted R2 calculation.

