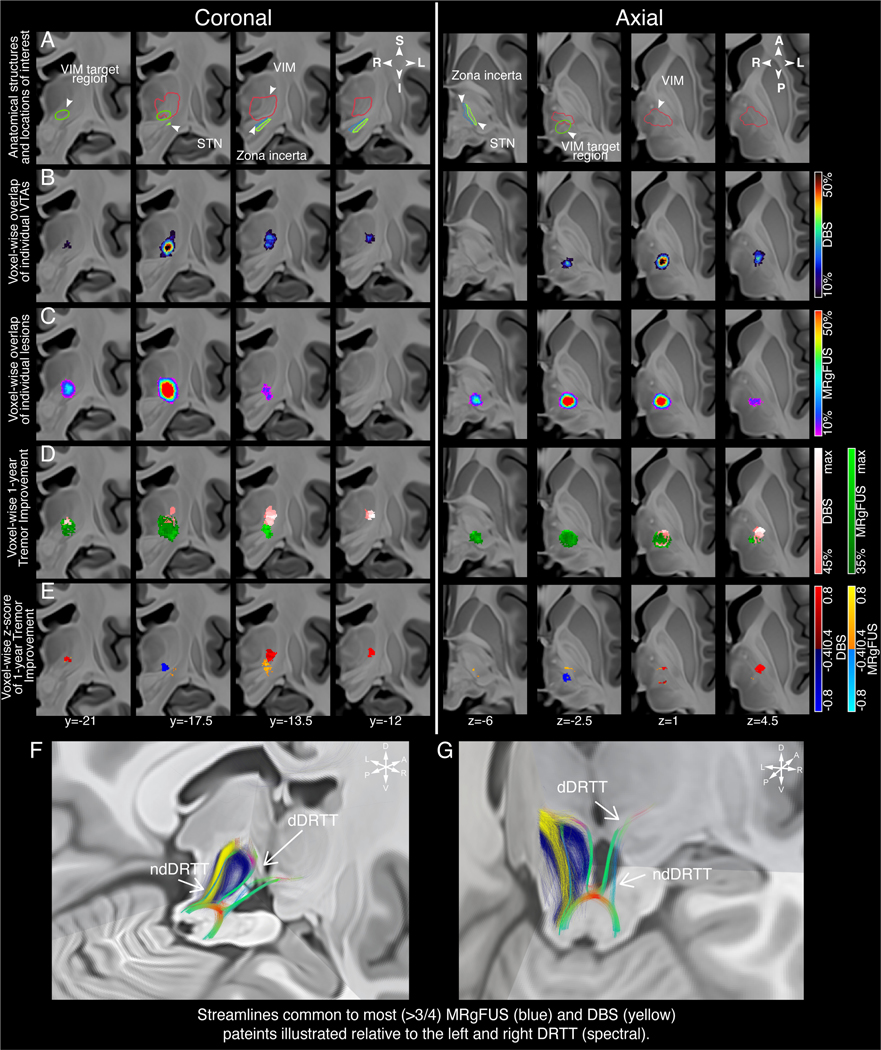
Figure 1: Stimulation/lesion localization and clinical response mapping.
Coronal images are presented from posterior to anterior and axial images from inferior to superior (labelled in MNI coordinates). A) Depiction of the VIM target region surrounding structures of interest. B) Localization of DBS stimulation on clinically optimal settings at the time of follow-up and C) MRgFUS lesions identified on peri-postoperative imaging. The VTAs and MRgFUS lesions for individual patients are represented as percent overlap and thresholded at a minimum of 10% overlap. D) Probabilistic maps denoting areas of stimulation/lesioning associated with clinical improvement are depicted and thresholded at a minimum of 35%/45% improvement for data visualization. E) Z-scores depicting voxels that produce above-mean (hot spots, warm colors) and below-mean (cold spots, cold colors) clinical improvement for each intervention. F and G) Tractography streamlines from >75% of DBS VTAs (yellow) and MRgFUS lesions (blue) are visualized relative to the DRTT. Localization, probabilistic maps, and tractography streamlines are projected on coronal slices of a 100μm resolution, single-echo multi-flip fast low-angle shot 7T brain in Montreal Neurological Institute (MNI) 152 space.16 MNI coordinates for each slice are displayed. Abbreviations: DBS, deep brain stimulation; DRTT, dentatorubrothalamic tract; ndDRTT, non-decussating dentatorubrothalamic tract; dDRTT, decussating dentatorubrothalamic tract; MRgFUS, magnetic resonance-guided focused ultrasound; STN, subthalamic nucleus; VIM, ventral intermediate nucleus; VTA, volume of tissue activated.

