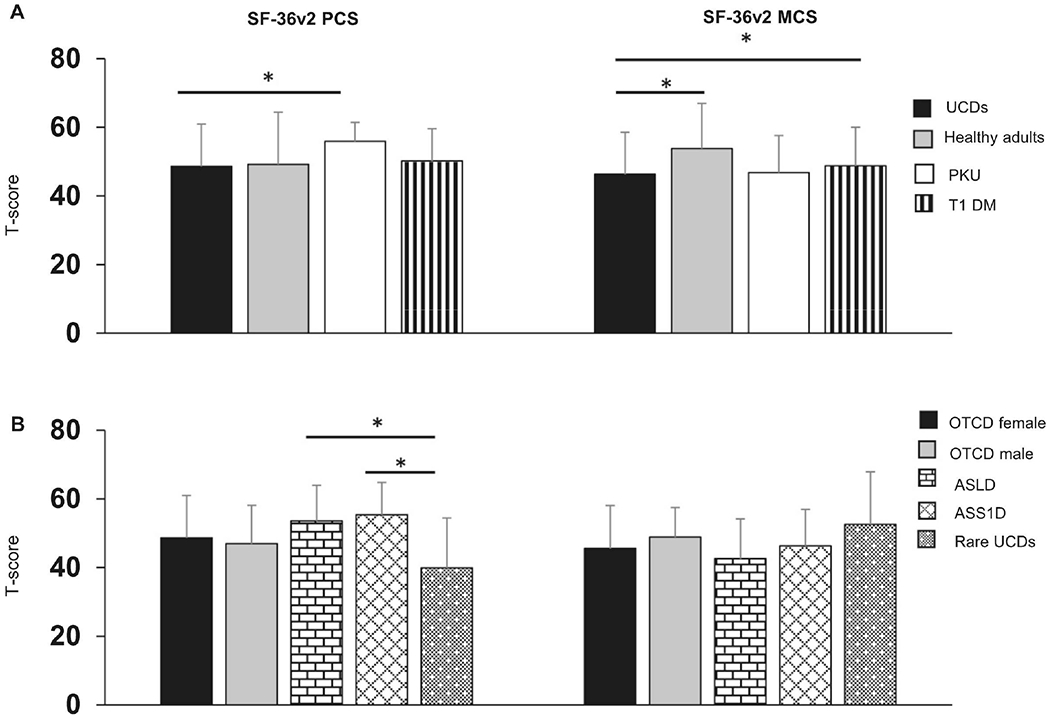
Figure 2. HRQoL in adults with UCDs.

A) PCS and MCS in adults with UCDs compared to healthy adults and adults with PKU and T1 DM. B) PCS and MCS in adults with UCDs categorized by UCD type. n for UCDs = 203, healthy adults = 3828, PKU=104, and T1 DM =1373. Bar graphs represent mean and standard deviation. *denotes significant Bonferroni adjusted p-value. i.e., *p< 0.017. The data for healthy adults are derived from Maglinte et al 2012. The data for adults with PKU are derived from Bosch et al 2015. The data for adults with T1DM are derived from Svedbo Engstrom et al 2019.
