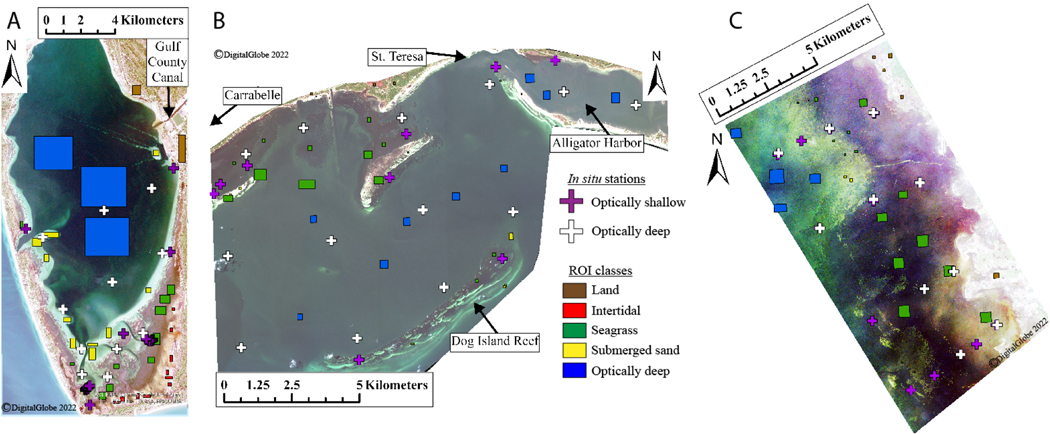
Figure 2.
RGB images of all three study sites, stretched using histogram equalization () to assist visualization of spectral differences. (A). St. Joseph Bay. (B). St. George Sound. (C). Keaton Beach. Mapped are the locations of stations used for atmospheric correction (white) and those that were fully characterized with respect to water column optics and seagrass abundance (purple) and Regions of Interest (ROIs) used for DCNN classification.

