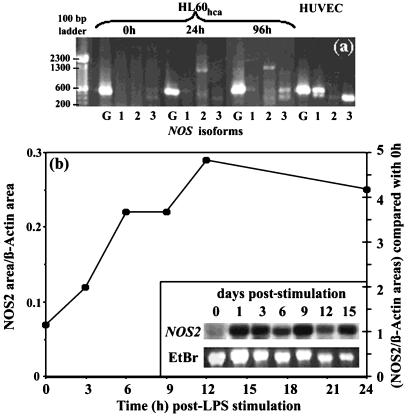
FIG. 3.
(a) RT-PCR for NOS1 (lanes 1), NOS2 (lanes 2), NOS3 (lanes 3), or a GAPDH control (lanes G) with RNA extracted from HL-60hca cells stimulated with LPS (100 ng/ml) for 0, 24, or 96 h and from unstimulated HUVEC controls. (b) Northern analysis of NOS2 gene expression in HL-60hca cells after various durations of stimulation with LPS (100 ng/ml). Kinetics over the first 24 h are shown by the graph, representing the ratio of NOS2 mRNA to β-actin mRNA as quantitated on a digital image as described in text. Longer kinetics are depicted in the inset, which compares NOS2 mRNA (Northern blot) with total RNA stained with ethidium bromide (EtBr). The molecular size of the NOS2 band is approximately 4.5 kb.

