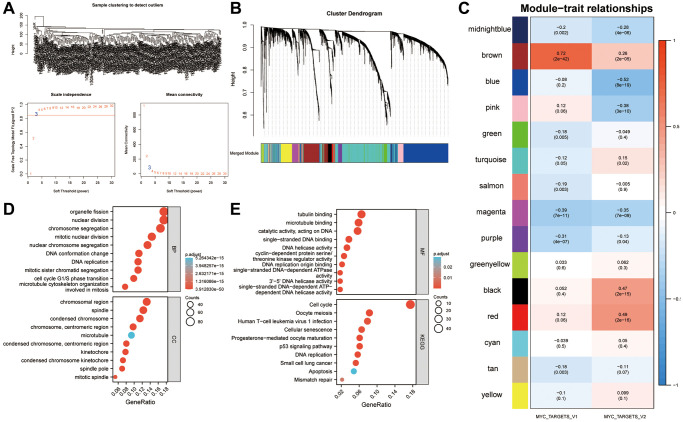
Figure 3.
Identification of a gene signature associated with the MYC targets V1 and V2. (A) Identification of DEGs in sarcoma. The variance of expression values for each gene in sarcoma patients (n = 256) was calculated using |log2FC|>1 and FDR < 0.05. (B) An analysis of the top 6000 DEGs was performed to identify non-grey modules in the WGCNA network. (C) Modules associated with key cancer hallmarks were constructed. The brown module had a higher correlation with MYC targets V1 (r = 0.72, P < 0.001) and V2 (r = 0.26, P < 0.001). (D, E) All genes from the brown module were analyzed using GO and KEGG. Abbreviations: WGCNA: weighted gene co-expression network analysis; DEG: differentially expressed genes; FDR: false discovery rate.

