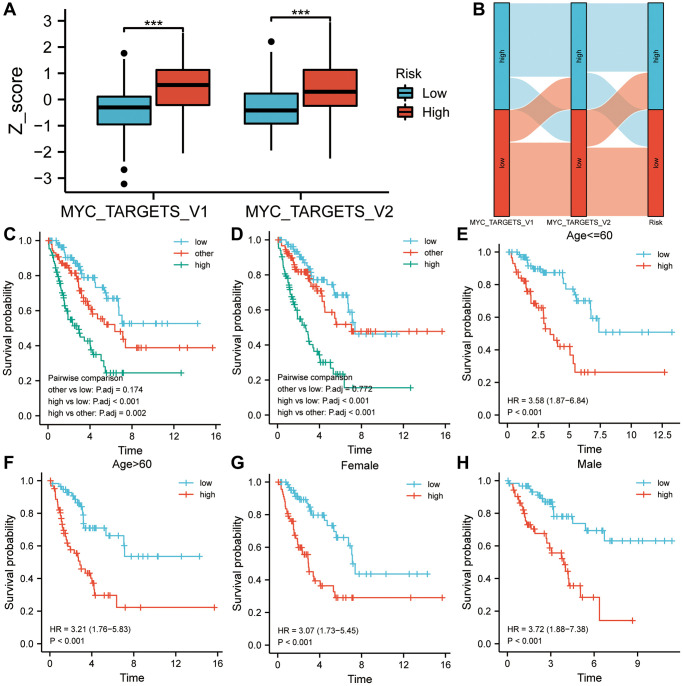
Figure 6.
A two-factor analysis of survival incorporating cancer hallmarks and risk scores. (A) MYC targets V1 and V2 of the high-risk group showed significantly higher Z-scores than those of the low-risk group. (B) A correlation analysis was conducted among the cancer hallmarks, the risk score, and the survival status of sarcoma patients. (C) High MYC targets V1 & high-risk score predicted a worse prognosis in a two-factor survival analysis. (D) High MYC targets V2 & high-risk score predicted a worse prognosis in a two-factor survival analysis. (E–H) In various subgroups based on clinicopathological characteristics, the risk score was a biomarker of poor prognosis. Abbreviation: HR: risk ratio.

