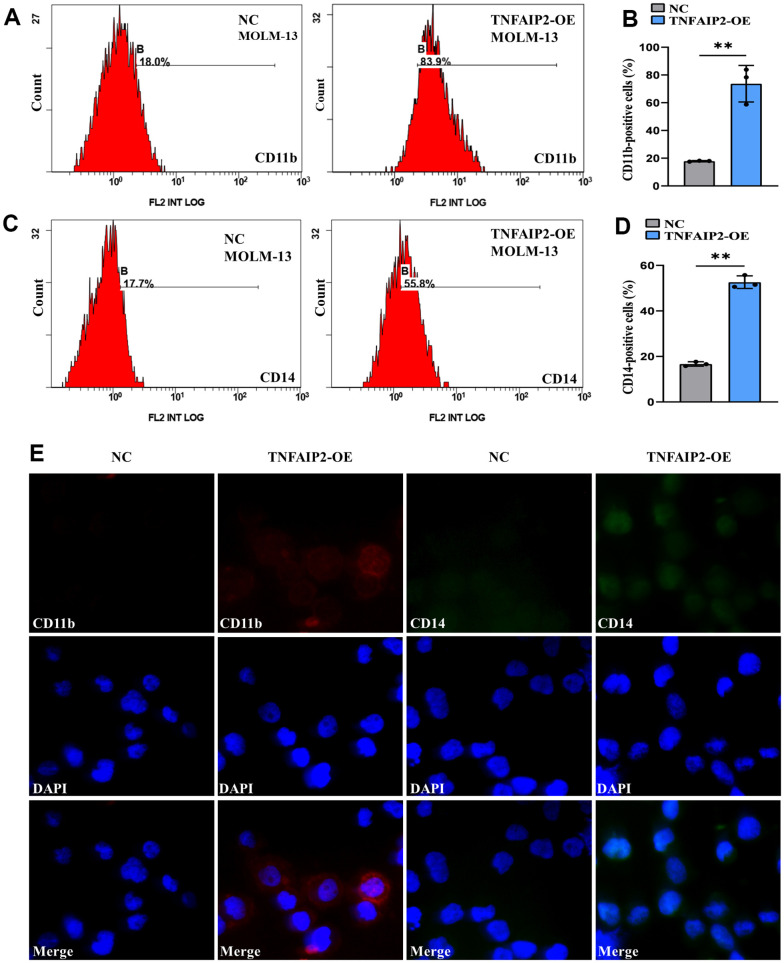
Figure 8.
Forced expression of TNFAIP2 significantly induced the differentiation of MOLM-13 cells. (A) Flow cytometric determination of the CD11b+ cell proportion in transduced MOLM-13 cells. (B) The CD11b statistical histogram. (C) Flow cytometric determination of the CD14+ cell proportion in transduced MOLM-13 cells. (D) The CD14 statistical histogram. (E) The immunofluorescence intensity of CD11b and CD14 in transduced MOLM-13 cells. Normal distribution, t test, ** P < 0.01.

