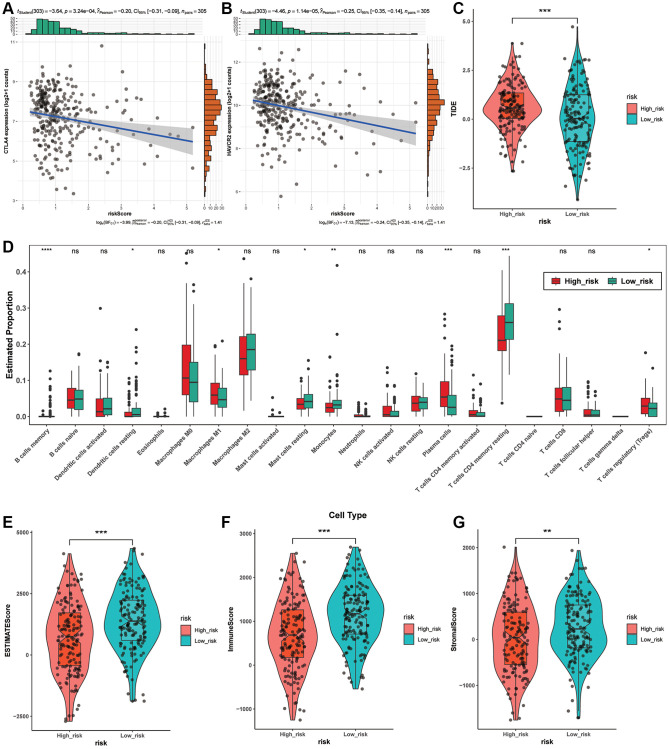
Figure 6.
Immunity analysis among different risk groups. (A, B) The association between risk scores and immune checkpoints based on the Pearson test. (C) The TIDE levels between two risk groups. (D) Tumor-infiltrating immune cells in different risk groups based on CIBERSORT. (E–G) The association between StromalScore, ImmuneScore, ESTIMATEScore and risk score.

