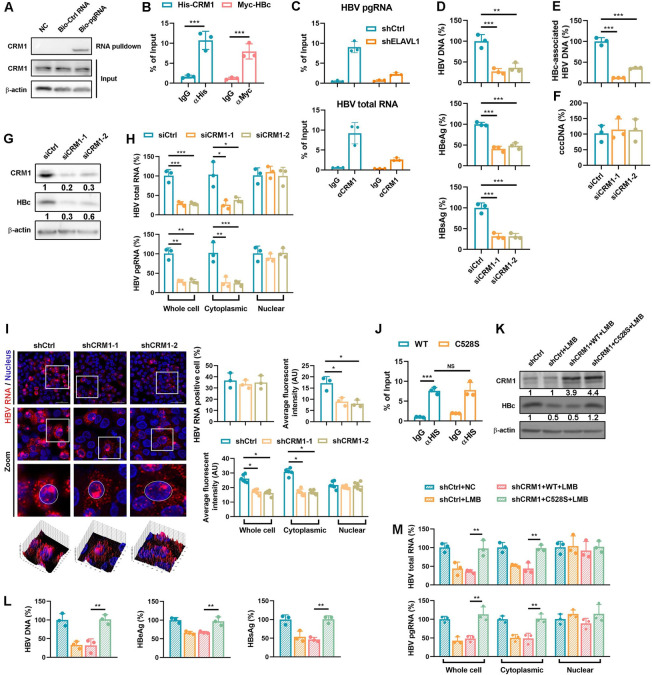
Fig 5. CRM1 is a nucleocytoplasmic transport factor for HBV RNAs.
(A) HepG2-NTCP cell lysates were incubated with wide-type or mutant biotinylated pgRNA or its mutant coated magnetic beads to pull down binding proteins. Levels of CRM1 in beads elutes were detected by WB. (B) His-CRM1 and pcDNA3.1-pgRNA were transfected into Huh7 cells. CRM1-pgRNA interaction was determined by RIP-qPCR. Myc-HBc and pcDNA3.1-pgRNA transfected Huh7 cells was set as a positive control. (C) ELAVL1 knockdown HepAD38 cells were maintained in DMEM medium containing 2% DMSO for 2 days. The binding of HBV RNA-CRM1 were detected by RIP assay. (D-H) HepG2-NTCP cells were transfected with CRM1 targeted siRNA. The cells were infected with HBV at an MOI = 200 and were maintained with DMEM medium supplemented with 2.5% DMSO for 5 days. (D) Levels of HBV-DNA in supernatants were determined by qPCR (% of siCtrl). Levels of secreted HBeAg and HBsAg levels were determined by ELISA (% of siCtrl). (E and F) Levels of intracellular HBc-associated DNA and HBV cccDNA were determined by qPCR (% of siCtrl). (G) Levels of CRM1 and HBc were determined by WB. (H) Subcellular levels of HBV mRNA in cytoplasm and nucleus were quantified by qPCR (% of siCtrl). Graphs were shown as mean ± SD. *, p < 0.5; **, p < 0.01; ***, p < 0.001. (I) The CRM1 knockdown HepG2-NTCP-K7 cells or control cells were infected with HBV at an MOI = 200. The cells were harvested at 7 dpi. RNAscope assay was applied to evaluate the subcellular distribution of HBV RNAs. Graphs were shown as mean ± SEM. *, p < 0.05; **, p < 0.01; ***, p < 0.001. Data were shown as mean ± SEM. *, p < 0.05. (J) His-CRM1 or its C528S mutant was transfected with pcDNA3.1-pgRNA into Huh7 cells. CRM1-pgRNA interaction was detected by RIP. (K-M) CRM1 knockdown HepG2-NTCP cells were transfected with wild type CRM1 or its C528S mutant. The cells were infected with HBV at an MOI = 200 and were maintained with DMEM medium supplemented with 2.5% DMSO for 7 days. The cells were treated with 250 ng/ml Leptomycin B from 3 days post infection. (K) Levels of CRM1 and HBc were determined by WB. (L) Levels of HBV-DNA in supernatants were determined by qPCR (% of shCtrl). Levels of secreted HBeAg and HBsAg were determined by ELISA (% of shCtrl). (M) Subcellular levels of HBV mRNA in cytoplasm and nucleus were determined by qPCR (% of shCtrl). Graphs were shown as mean ± SD. **, p < 0.01; ***, p < 0.001.

