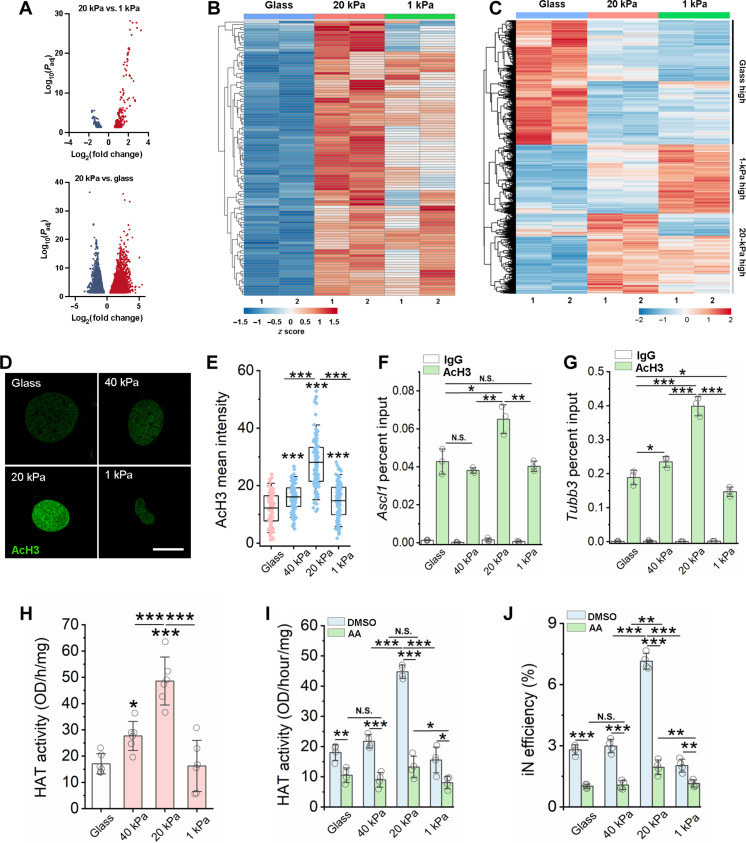
Fig. 2. Matrix stiffness modulates chromatin accessibility, gene expression, HAT activity, and histone acetylation.
(A) Volcano plot showing differential accessible regions. Red and blue dots indicate regions with increased or decreased chromatin accessibility, respectively. (B) Heatmap representation of differentially accessible regions that overlap with Ascl1 ChIP-seq peaks (GSE43916: SRX323557). Each row represents a differential region; each column is one biological replicate of the indicated condition. (C) Heatmap representation of differentially expressed genes at day 3. (D) Immunofluorescent images of AcH3 in non-transduced fibroblasts at day 2. Scale bar, 10 μm. (E) Quantification of AcH3 intensity based on experiments in (A) (n ≥ 116). (F and G) ChIP-qPCR analysis shows the percent input of AcH3 at the promoter regions of Ascl1 (F) and Tubb3 (G) in BAM-transduced fibroblasts at day 3 (n = 3). (H) Quantification of HAT activity at day 2 (n = 6). (I) Quantification of HAT activity in fibroblasts cultured on various substrates for 1 day followed by treatment with vehicle control [dimethyl sulfoxide (DMSO)] or a HAT inhibitor [anacardic acid (AA)] for 24 hours (n = 4). (J) Reprogramming efficiency of BAM-transduced fibroblasts cultured on matrices of varying stiffness and pre-treated with anacardic acid for 24 hours before adding Dox (n = 4). In (E) to (J), statistical significance was determined by a one-way ANOVA and Tukey’s multiple comparison test (*P ≤ 0.05, **P ≤ 0.01, and ***P ≤ 0.001). In (E), box plots show the ends at the quartiles, the mean as a horizontal line in the box, and the whiskers represent the SD. In (F) to (J), bar graphs show means ± SD.

