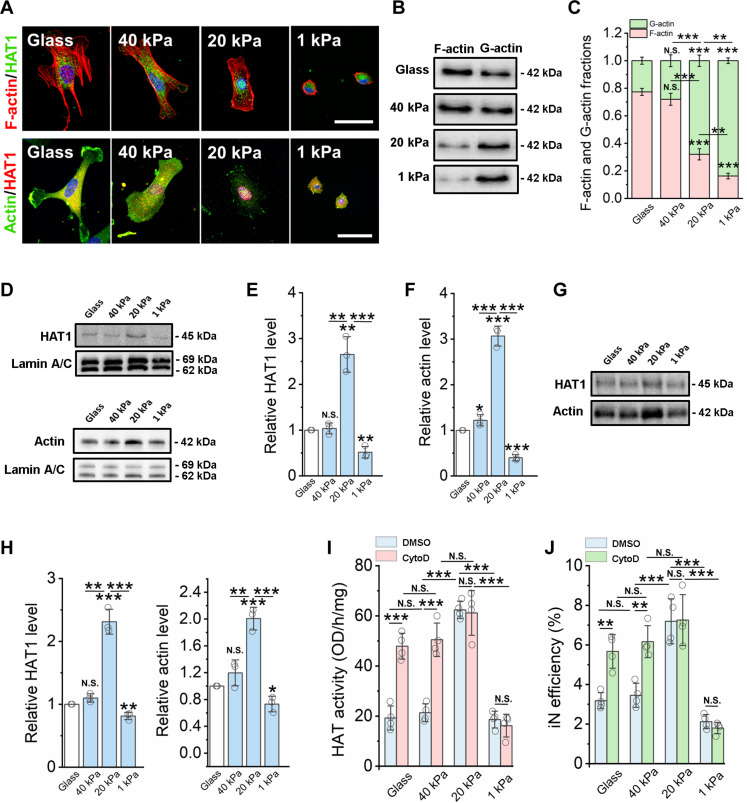
Fig. 3. Matrix stiffness modulates the nuclear translocation of HAT via actin assembly.
(A) Immunofluorescent images of fibroblasts cultured on glass and PAAm gels of various stiffness for 2 days and stained for F-actin (phalloidin, red), HAT1, and β-actin (green). Scale bars, 50 μm. (B) Western blotting analysis shows F-actin and G-actin levels in fibroblasts cultured on glass and PAAm gels for 2 days. (C) Quantification of F-actin and G-actin fractions from Western blots (n = 3). (D) Western blotting analysis shows HAT1 and β-actin levels from nuclear fractions of fibroblasts cultured on glass and PAAm gels of varying stiffness for 2 days, where lamin A/C serves as a housekeeping protein. (E) Quantification of HAT1 level from Western blots (n = 3). (F) Quantification of actin level from Western blots (n = 3). (G) Co-immunoprecipitation of HAT1 and actin from nuclear fractions of fibroblasts on glass or varying matrix stiffness. (H) Quantification of HAT1 and actin levels from co-immunoprecipitation Western blot (n = 3). (I) Quantification of HAT activity in fibroblasts cultured on various substrates for 1 day, followed by treatment with vehicle control (DMSO) or an actin polymerization inhibitor [cytochalasin D (CytoD); 0.5 μM] for 24 hours (n = 4). (J) Reprogramming efficiency of BAM-transduced fibroblasts cultured on various substrates and pretreated with cytochalasin D (0.5 μM) for 24 hours before adding Dox (n = 4). In (C), (E), (F) and (H) to (J), statistical significance was determined by a one-way ANOVA and Tukey’s multiple comparison test (*P ≤ 0.05, **P ≤ 0.01, and ***P ≤ 0.001). In (C), (E), (F) and (H) to (J), bar graphs show means ± SD.

