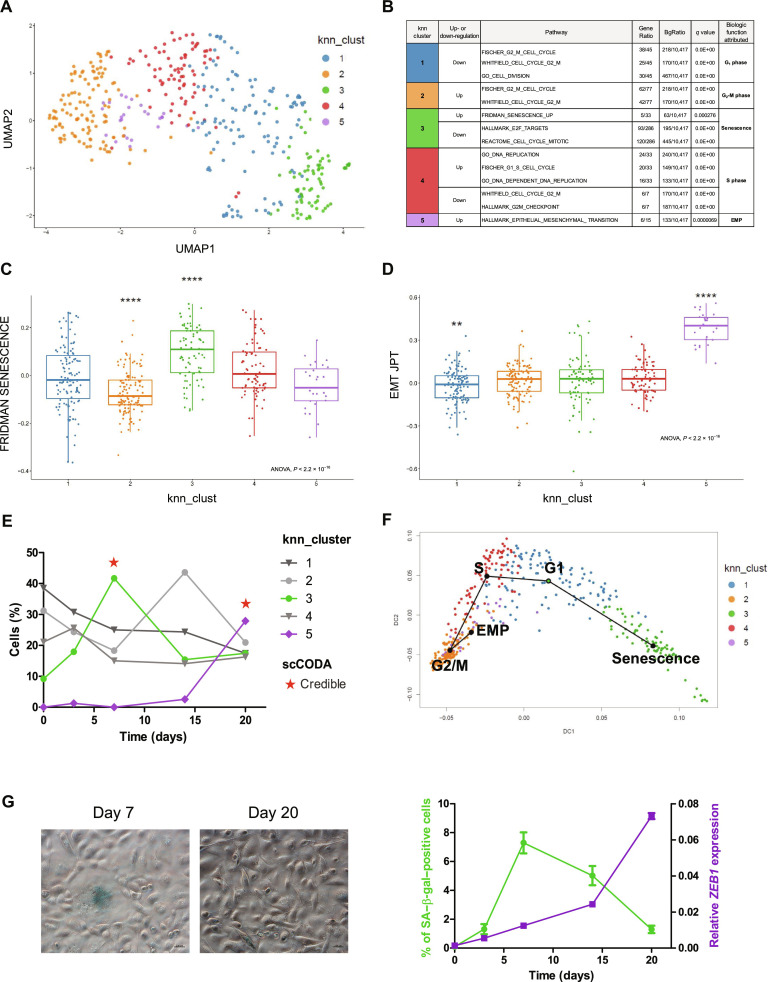
Fig. 3. Identification of distinct senescence and EMP clusters in induced HME-RASER.
(A) Unsupervised uniform manifold approximation and projection (UMAP) of the transcriptome of all cells at all time points (D0, D3, D7, D14, and D20). Cells are colored by their attributed cluster. (B) Main altered pathways by marker genes for each cluster. Gene ratio is presented as k/n, where k is the size of the overlap of our input with the specific gene set and n is the size of the overlap of our input with all members of the collection of gene sets. q Value refers to false discovery rate. (C and D) Scores per cell for two transcriptomic pathways: (C) FRIDMAN SENESCENCE (ssGSEA score) and (D) EMT JPT [EMT cell line score from (29)]. Cells are grouped by clusters, each box representing the median and interquartile ranges. Individual Wilcoxon tests, P value is represented by stars (**P ≤ 0.01 and ****P ≤ 0.0001). (E) Proportion of cells by cluster at each time point. Emerging clusters across time (cluster 3 in green and cluster 5 in purple) and statistical compositional single cells analysis by scCODA (* indicates credible change). (F) Trajectory curves projected onto a diffusion map for dimension reduction. Cells are colored by k-nearest neighbor (knn) clusters. Starting point of the trajectory analysis is cluster 1 (green circle). (G) Left: Representative images of senescence-associated β-galactosidase (SA–β-gal) activity in induced HME-RASER cells at D7 and D20 (scale bars, 200 μm). Right: Percentage of SA–β-gal–positive cells (green) and ZEB1 mRNA expression (purple) across time after RAS activation in induced HME-RASER cells. Median ± range (n = 3 independent experiments).

