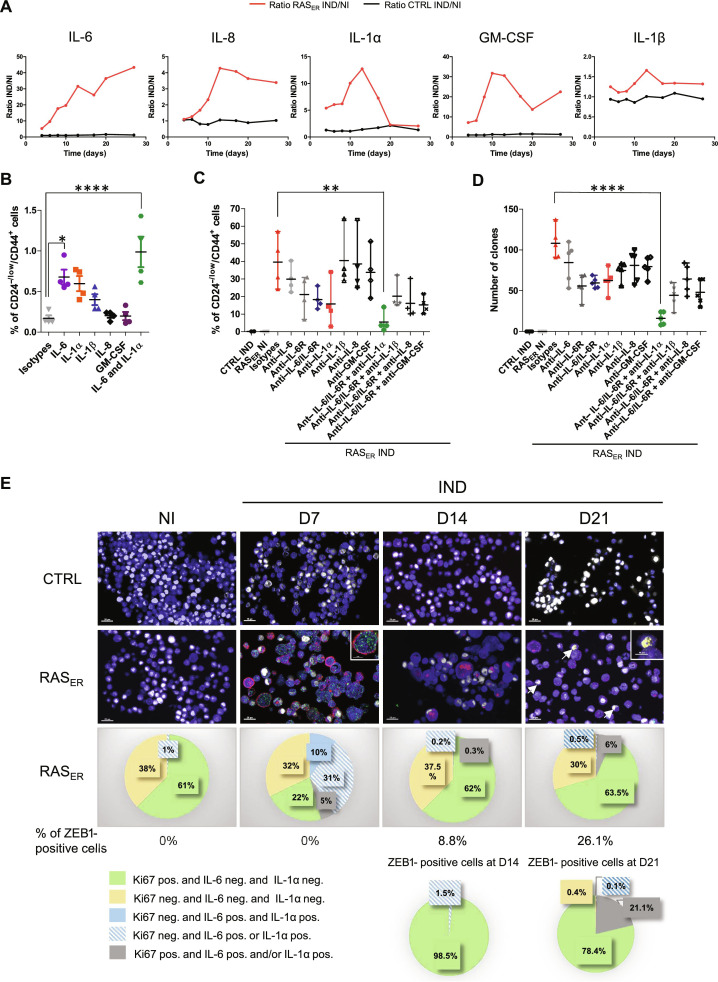
Fig. 6. IL-6 and IL-1α are major cytokines responsible for ZEB1-dependent EMP.
(A) Quantification of cytokine levels in HME-RASER supernatants following 4-OHT treatment compared to controls at D4, D6, D8, D10, D13, D17, D20, and D27. Data are presented as fold change of secreted cytokine concentrations in HME-RASER or HME-CTRL cells induced by 4-OHT (IND) or not (NI). (B) Quantification by flow cytometry analysis of CD24−/low/CD44+ population of HMECs after treatment by the indicated cytokine(s) or isotype controls analyzed at D40. Median ± range (n = 4 independent experiments). (C) Quantification by flow cytometry analysis of CD24−/low/CD44+ population of HME-RASER (RASER) cells induced by 4-OHT (IND) or not (NI) and treated by neutralizing antibodies or isotype controls analyzed at D28. Median ± range (n = 4 independent experiments). (D) Transformation potential analysis by soft agar colony formation assay in HME-RASER (RASER) cells induced by 4-OHT (IND) or not (NI) and treated by neutralizing antibodies or isotype controls analyzed at D28. Median ± range (n = 5 independent experiments). (E) Top: multi-fluorescence staining kinetics. HME-RASER (RASER) and HME-CTRL (CTRL) cells were induced by 4-OHT (IND) or not (NI) and stained with anti-Ki67 (white), anti–IL-6 (green), anti–IL-1α (red), and anti-ZEB1 (yellow) at D7, D14, and D21. Representative pictures are shown (scale bars, 20 and 10 μm in enlarged pictures). Bottom: Graphical representation of cellular phenotype distribution according to Ki67, IL-6, IL-1α, or ZEB1 staining. P values are calculated by one-way ANOVA, Tukey multiple comparisons test (**P < 0.01 and ****P < 0.0001).

