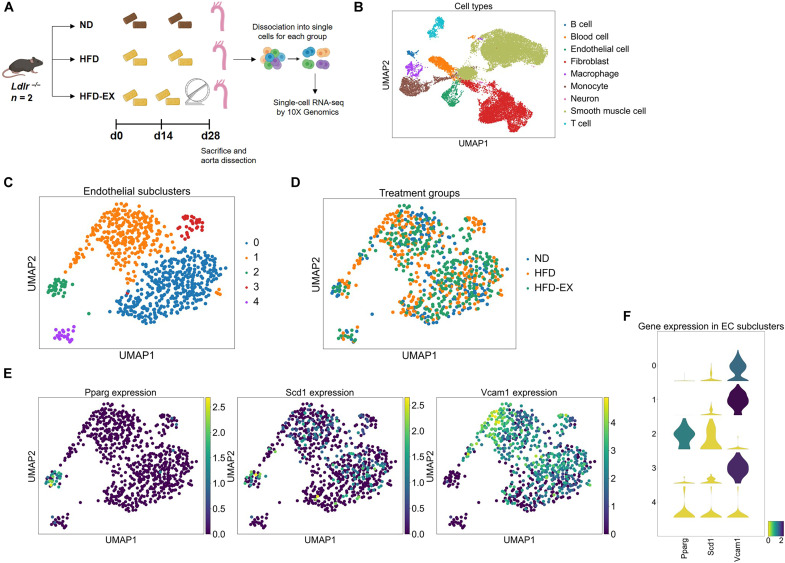
Fig. 8. Single-cell transcriptomic analysis of the mouse aorta.
(A) Schematic diagram of the experimental protocol. Ldlr−/− mice (n = 2 per group) were subjected to normal chow diet (ND, control), HFD, or HFD plus 2-week exercise (HFD-EX). Aortas were collected after 28 days. A total of 20,000 cells were analyzed. (B) Representative uniform manifold approximation and projection (UMAP) of cellular clusters in the mouse aorta indicates nine cell types with specific vascular lineages. (C and D) Representative UMAP of endothelial cells in the mouse aorta indicates the presence of five subclusters across the three experimental conditions. (E and F) Changes in Pparγ, Scd1, and Vcam1 expression identify an endothelial subcluster in which higher levels of Pparγ and Scd1 are associated with a low level of Vcam1 expression.

