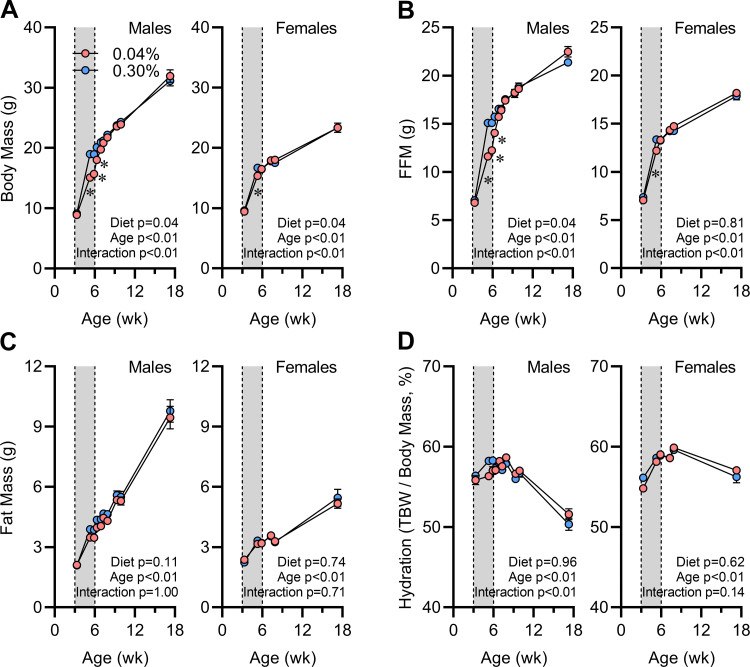
Figure 3.
Body composition effects of early-life Na depletion are not sustained. A: body mass vs. age. B: fat-free mass (FFM) vs. age. C: fat mass vs. age. D: total body hydration calculated as total body water (TBW) per body mass vs. age. For all panels, 0.04% n = 6 male + 8 female vs. 0.30% n = 8 male + 8 female, Data analyzed by 2-way repeated-measures ANOVA, and data presented as means ± SE.

