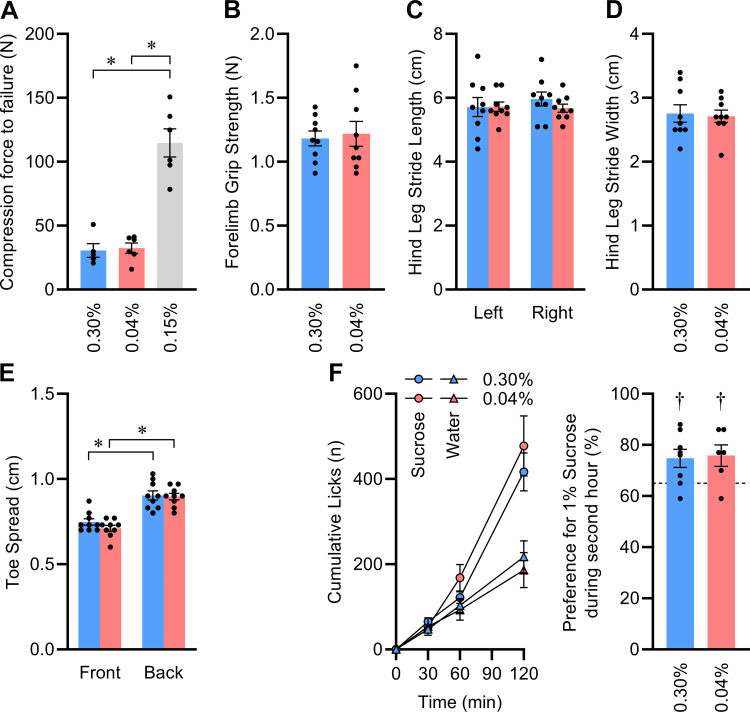
Figure 5.
No evidence of muscle deficits or taste changes to explain reduced meal size and rate after early-life Na depletion. A: compression force to failure of representative pellets of each food type; n = 5 or 6 per diet, analyzed by 1-way ANOVA followed by Šídák's multiple comparisons test (*P < 0.05). B: forelimb grip strength. C: hind leg stride length. D: hind leg stride width. E: toe spread. F: 2-h, 2-bottle intake preference test by lickometry, assessing relative intake of 1% sucrose solution vs. deionized water, with 0.04% n = 6 vs. 0.30% n = 8, at 16 wk of age. For B–E, n = 9 per group at 12 wk of age. B, D, and F analyzed by independent 2-tailed t test. C and E analyzed by 2-way ANOVA followed by Šídák's multiple comparisons test (*P < 0.05). In F, †P < 0.05 determined by 1-sample t test vs. 65% (illustrated by dashed line), as a threshold to define an intake preference. For all panels, data presented as means ± SE.

