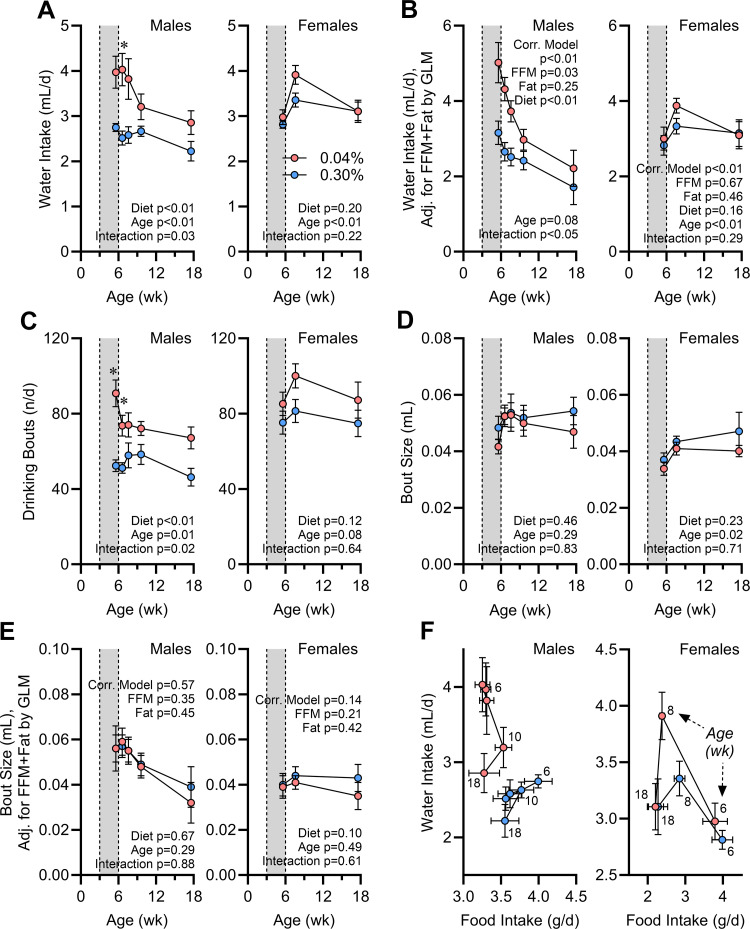
Figure 6.
Water intake behaviors are programmed by early-life Na depletion. A: total daily water intake vs. age. d, Day. B: water intake corrected for fat-free mass (FFM; males 17.67 g, females 14.79 g) and fat mass (males 5.27 g, females 3.71 g) by general linear modeling (GLM). C: total daily drinking bouts vs. age. D: average volume of individual drinking bouts vs. age. E: average drinking bout volume corrected for FFM (males 17.67 g, females 15.03 g) and fat mass (males 5.27 g, females 3.79 g) by GLM. F: correlation of water intake vs. food intake per day at each age. For all panels, 0.04% n = 6 males + 8 females vs. 0.30% n = 8 males + 8 females, and data presented as mean or estimated marginal means ± SE. For A, C, and D, data analyzed by 2-way repeated-measures ANOVA, followed by Šídák's multiple comparisons test (*P < 0.05). For B and E, data analyzed by GLM.

