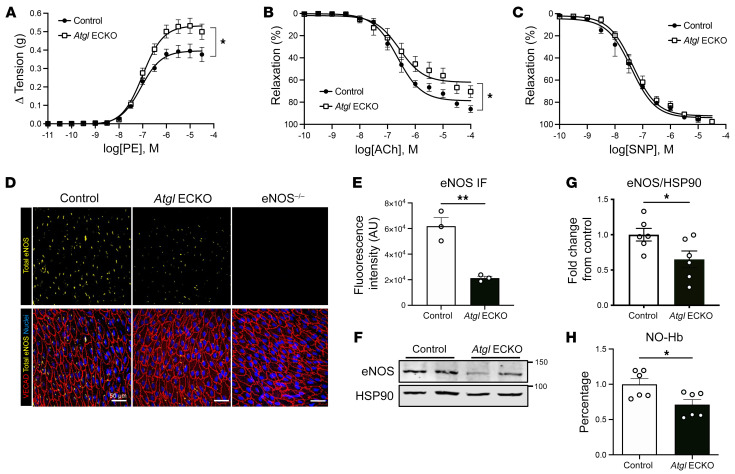
Figure 2. ATGL deficiency leads to endothelial dysfunction.
(A) Cumulative concentration-response curves of developed isometric tension in response to PE in aortic rings harvested from control and Atgl ECKO mice. (B) Cumulative concentration-response curves representing percentages of relaxation of precontracted vessels in response to ACh and (C) the NO˙ donor, SNP, in aortic rings harvested from control and Atgl ECKO mice. Data are represented as mean values ± SEM of 5 to 6 individual experiments (4 rings per mouse). *P < 0.05, 2-way ANOVA with Šidák’s multiple-comparison test. (D) Representative confocal images of en face immunostaining of eNOS protein levels (yellow) in thoracic aorta from control (far left), Atgl ECKO (middle), and eNOS–/– (far right) mice processed and stained identically. ECs were detected by immunostaining for VECAD (red), and nuclei were stained with DAPI (blue). (E) Quantification of aortic images (n = 3/group). **P < 0.01, unpaired, 2-tailed Student’s t test. Scale bars: 50 μm. (F) Representative Western blot analysis showing eNOS protein levels in aortic homogenates of control and Atgl ECKO mice and (G) quantification of n = 6/group. *P < 0.05, unpaired, 2-tailed Student’s t test. (H) EPR determined nitrosyl-hemoglobin (NO-Hb) in venous blood as an index of NO bioavailability in control and Atgl ECKO mice. n = 6/group. *P < 0.05, unpaired, 2-tailed Student’s t test.

