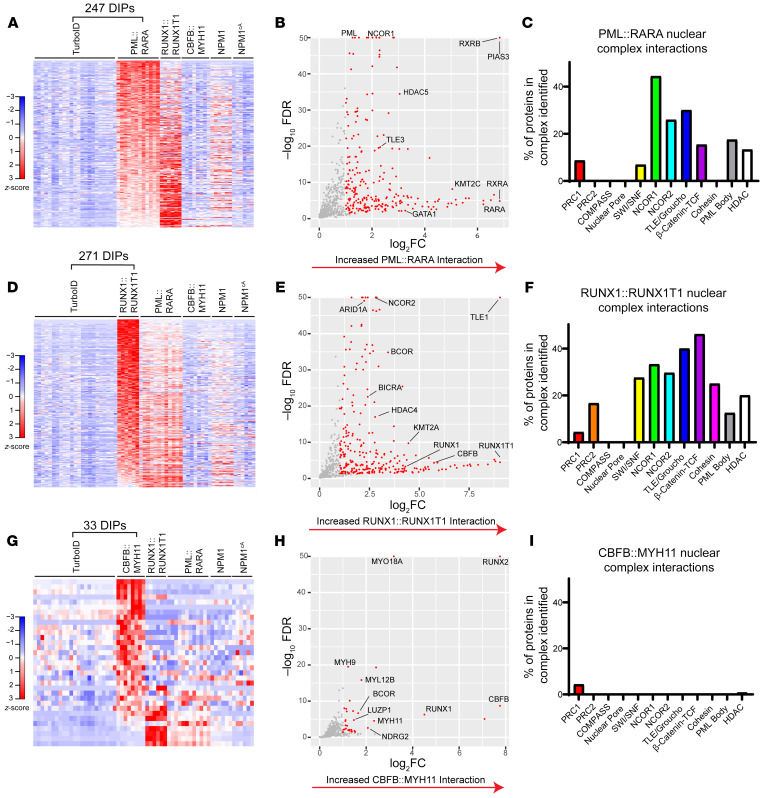
Figure 2. PML::RARA, RUNX1::RUNX1T1, and CBFB::MYH11 have distinct protein interactomes in mouse hematopoietic cells.
(A) Heatmap showing differentially interacting proteins (DIPs) (edgeR, FDR < 0.05, >2-fold change) with increased detection in PML::RARA-TurboID fusion samples (n = 12) relative to TurboID-alone samples (n = 23); the same proteins detected with the other TurboID fusion samples are plotted “passively.” Data are shown as z-scored normalized spectral counts. (B) Volcano plot of proteins identified in A, with selected proteins labeled. (C) The percentage of proteins in selected nuclear complexes with detectable interactions with PML::RARA-TurboID fusion, relative to TurboID alone. (D) Heatmap showing DIPs with increased detection in RUNX1::RUNX1T1-TurboID fusion samples (n = 6) relative to TurboID-alone samples (n = 23). (E) Volcano plot of proteins identified in D, with selected proteins labeled. (F) The percentage of proteins in selected nuclear complexes with detectable interactions with RUNX1::RUNX1T1-TurboID fusion, relative to TurboID alone. (G) Heatmap showing DIPs with increased detection in CBFB::MYH11-TurboID fusion samples (n = 8), relative to TurboID-alone samples (n = 23). (H) Volcano plot of proteins identified in G, with selected proteins labeled. (I) The percentage of proteins in selected nuclear complexes with increased interaction with CBFB::MYH11-TurboID fusions, relative to TurboID alone.

