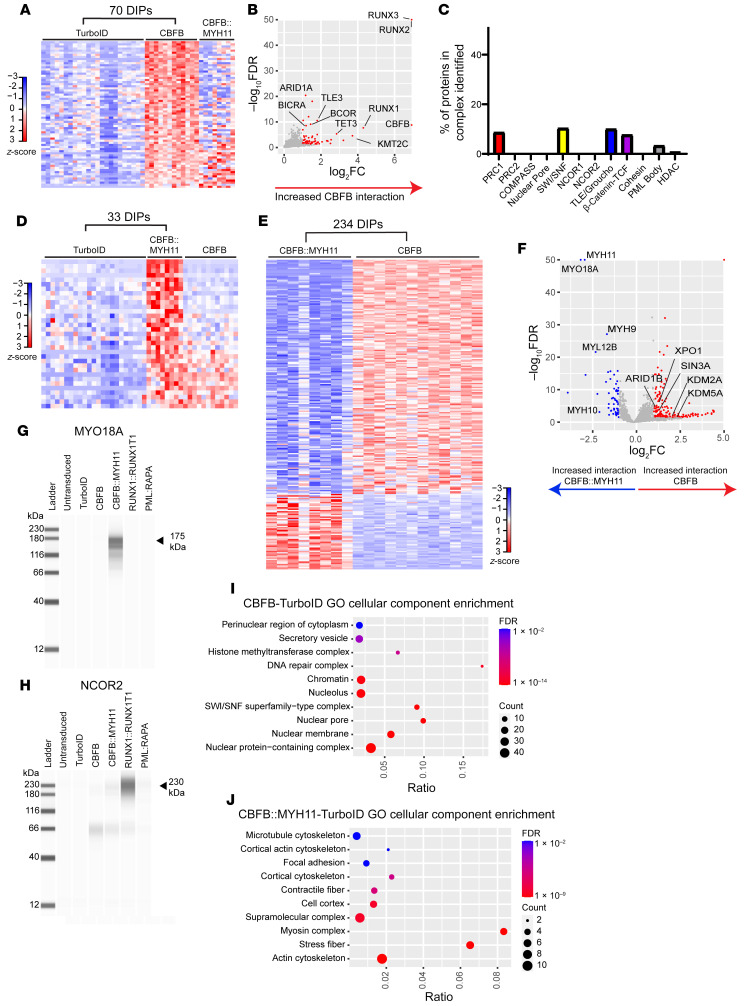
Figure 3. CBFB and CBFB::MYH11 have distinct protein interactomes.
(A) Heatmap showing DIPs with increased detection in CBFB-TurboID fusion samples (n = 12), relative to TurboID alone (n = 23); proteins detected with the CBFB::MYH11-TurboID fusion protein are plotted passively. (B) Volcano plot of proteins identified in A, with selected DIPs labeled. (C) Percentage of proteins in selected nuclear complexes with increased interaction with CBFB-TurboID fusion relative to TurboID alone. (D) Heatmap showing DIPs with increased detection in CBFB::MYH11-TurboID fusion samples (n = 8) relative to TurboID-alone samples, with CBFB-TurboID samples passively plotted. (E) Heatmap showing DIPs between CBFB-TurboID and CBFB::MYH11-TurboID fusion proteins. (F) Volcano plot of DIPs between CBFB- and CBFB::MYH11-TurboID fusions, with key differential interactors labeled. Myosin-related proteins exclusively interact with CBFB::MYH11, while CBFB interacts predominantly with nuclear proteins. (G and H) Gel images of ProteinSimple Jess blot on streptavidin beads from HSPCs expressing the indicated TurboID fusions using an antibody against MYO18A (G) or NCOR2 (H). Note pull-down of MYO18A in CBFB::MYH11-TurboID fusion, and NCOR2 pull-down in RUNX1::RUNX1T1-TurboID fusion. (I and J) ToppFun pathway enrichment for CBFB-TurboID versus CBFB::MYH11-TurboID DIPs enriched in CBFB-TurboID (I) or CBFB::MYH11-TurboID (J). Ratio indicates number of genes identified as DIPs divided by number of genes in gene set. Circle size indicates number of proteins identified. FDR, Benjamini-Hochberg FDR.

