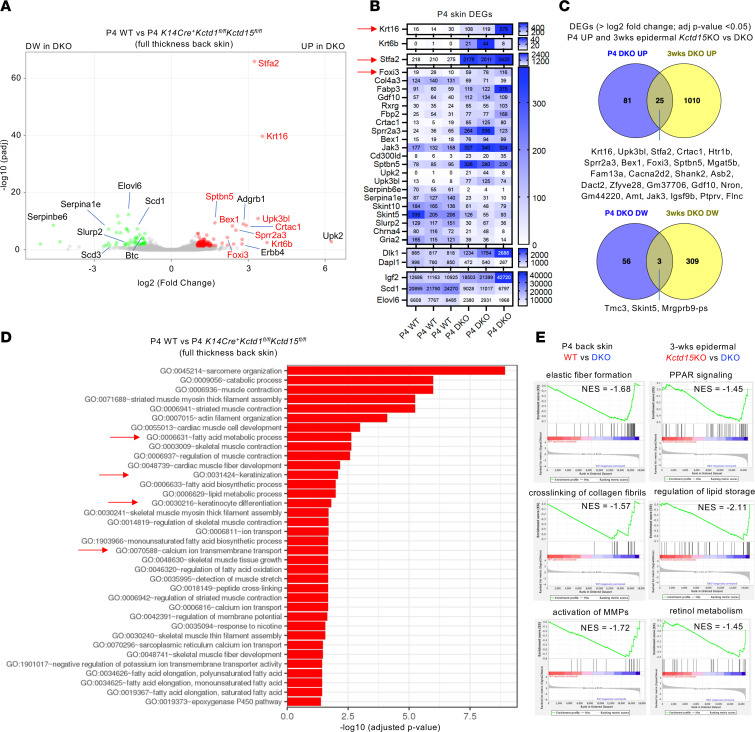
Figure 7. Transcriptomic characterization of skin abnormalities in K14Cre+Kctd1fl/flKctd15fl/fl mice.
(A) Volcano plot of RNA-Seq data from back skin of P4 control mice compared with K14Cre+Kctd1fl/flKctd15fl/fl mice. (B) Heatmap shows expression of selected differentially expressed genes (DEGs) in the back skin of P4 control mice compared with K14Cre+Kctd1fl/flKctd15fl/fl mice. Upregulated DEGs in the skin of K14Cre+Kctd1fl/flKctd15fl/fl mice include Krt16, Foxi3, and Stfa2 (arrows). (C) Venn diagrams show DEGs in P4 back skin or 3-week-old back skin epidermis of K14Cre+Kctd1fl/flKctd15fl/fl mice (compared with K14Cre+Kctd15fl/fl mice that did not have hair/skin abnormalities). Among DEGs upregulated at both time points examined are Foxi3, Krt16, and Stfa2. (D) Gene Ontology (GO) enrichment analysis of P4 back skin RNA-Seq data from K14Cre+Kctd1fl/flKctd15fl/fl mice versus control littermates. (E) GSEA shows downregulated pathways in the back skin of P4 K14Cre+Kctd1fl/flKctd15fl/fl mice, as well as in the back skin epidermis of 3-week-old K14Cre+Kctd1fl/flKctd15fl/fl mice compared with K14Cre+Kctd15fl/fl mice. NES, normalized enrichment score.

