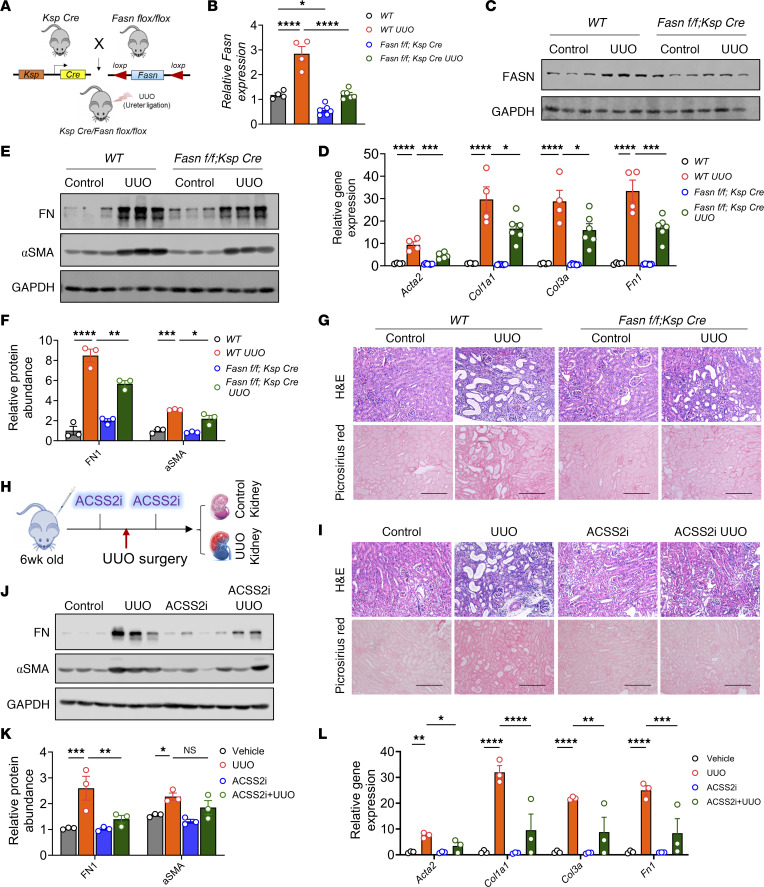
Figure 4. Tubule cell–specific deletion of FASN or pharmacological inhibition of ACSS2 protects against kidney disease.
(A) Experimental design. (B) Transcript levels of Fasn (n = 4, WT; n = 6, Fasnfl/fl Ksp Cre). (C) Immunoblots of FASN and GAPDH levels in Fasnfl/fl Ksp Cre and WT mice. (D) Transcript levels of Acta2, Col1a1, Col3a, and Fn1 in kidneys of Fasnfl/fl Ksp Cre (n = 6) and WT (n = 4) mice. (E) Immunoblots showing FN1, αSMA, and GAPDH levels in kidneys of Fasnfl/fl Ksp Cre and WT mice following UUO. (F) Quantification of FN1 and αSMA immunoblots by ImageJ. (G) H&E and Picrosirius red staining of UUO kidneys from Fasnfl/fl Ksp Cre and WT mice (left). Fibrosis was quantified using ImageJ (right). Scale bars: 20 μm. (H) ACSS2i experimental design. (I) H&E and Picrosirius red staining of UUO kidneys from mice injected or not with ACSS2i. Scale bars: 20 μm. (J) Immunoblots showing FN1, αSMA, and GAPDH levels in kidneys of mice injected with ACSS2i that are subjected to UUO. (K) Quantification of FN1 and αSMA immunoblots by ImageJ. (L) Transcript levels of Acta2, Col1a1, Col3a, and Fn1 in UUO kidneys of mice injected with ACSS2i (n = 3) or PBS (n = 3). Data are presented as the mean ± SEM. *P < 0.05, **P < 0.01, ***P < 0.001, and ****P < 0.0001, by 1-way ANOVA after Tukey’s multiple-comparison test (B, D, F, K, and L). Data in B–G are representative of multiple experiments. The protein marker was cropped from all blots but is presented in the full blots file.

