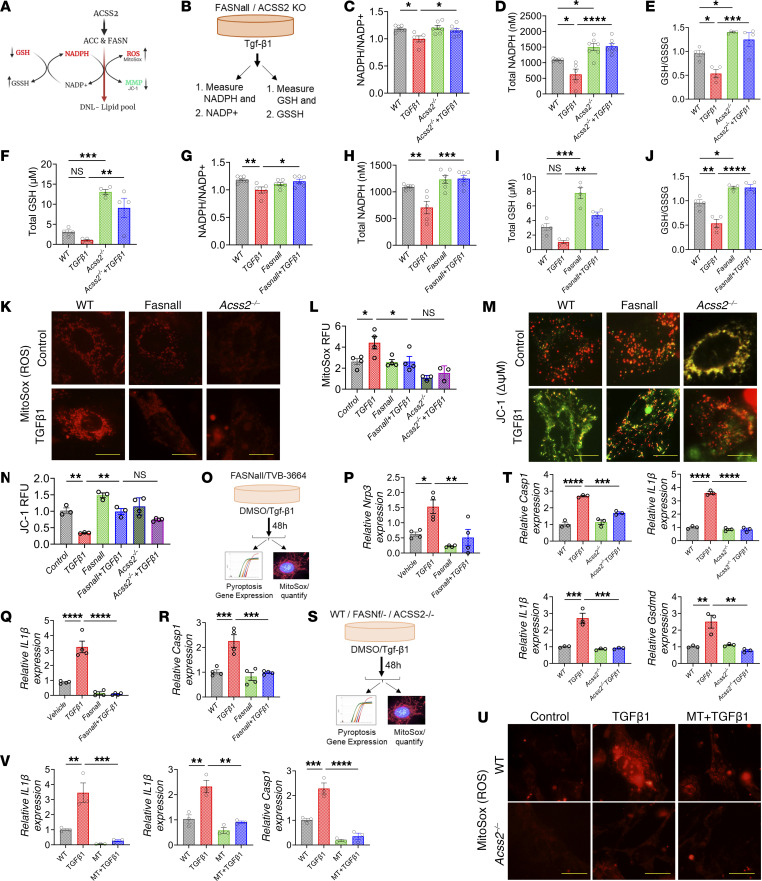
Figure 5. DNL in kidney tubules is associated with higher mtROS.
(A) Fatty acid synthesis requires a large amount of NADPH, leading to elevated ROS levels in the kidneys. MMP, mitochondria membrane potential. (B) Experimental hypothesis. (C) NADPH+/NDP+ ratio in tubule cells treated with TGF-β1. (D) Total NADPH levels in Acss2–/– cells treated with TGF-β1. (E) GSH/GSSG ratio in Acss2–/– cells treated with TGF-β1. (F) Total GSH levels in Acss2–/– cells treated with TGF-β1. (G) NADPH+/NDP+ ratio in cells treated with TGF-β1 and FASNall. (H) Total NADPH levels in cells treated with TGF-β1 and FASNall. (I) Total GSH levels in cells treated with TGF-β1 and FASNall. (J) GSH/GSSG ratio in cells treated with TGF-β1 and FASNall. (K) MitoSox staining in WT, Acss2–/–, and FASNall-cells treated with TGF-β1. Scale bars: 10 μm. (L) Quantification of MitoSox fluorescence. (M) JC-1 staining of WT, Acss2–/–, and FASNall cells treated with TGF-β1. Scale bars: 10 μm. (N) Quantification of JC-1 (red/green ratio) fluorescence. RFU, relative fluorescence units. (O) Experimental scheme. (P) Transcript levels of Nlrp3 in tubule cells treated with FASNall and TGF-β1. (Q) Transcript levels of IL1B in tubule cells treated with FASNall and/or TGF-β1. (R) Transcript levels of Casp1 in tubule cells treated with FASNall and/or TGF-β1. (S) Experimental scheme. (T) Transcript levels of Casp1, IL1B, IL18, and Gsdmd in Acss2–/– tubule cells treated with TGF-β1. (U) MitoSox staining and (V) transcript levels of IL1B, IL18, and Casp1 in Acss2–/– tubular cells treated with TGF-β1 and/or MT. Scale bars: 10 μm. Data are presented as the mean ± SEM. Each experiment was repeated at least twice, and the data presented in this figure are representative of multiple experiments. *P < 0.05, **P < 0.01, ***P < 0.001, and ****P < 0.0001, by 1-way ANOVA after Tukey’s multiple-comparison test (C–V).

