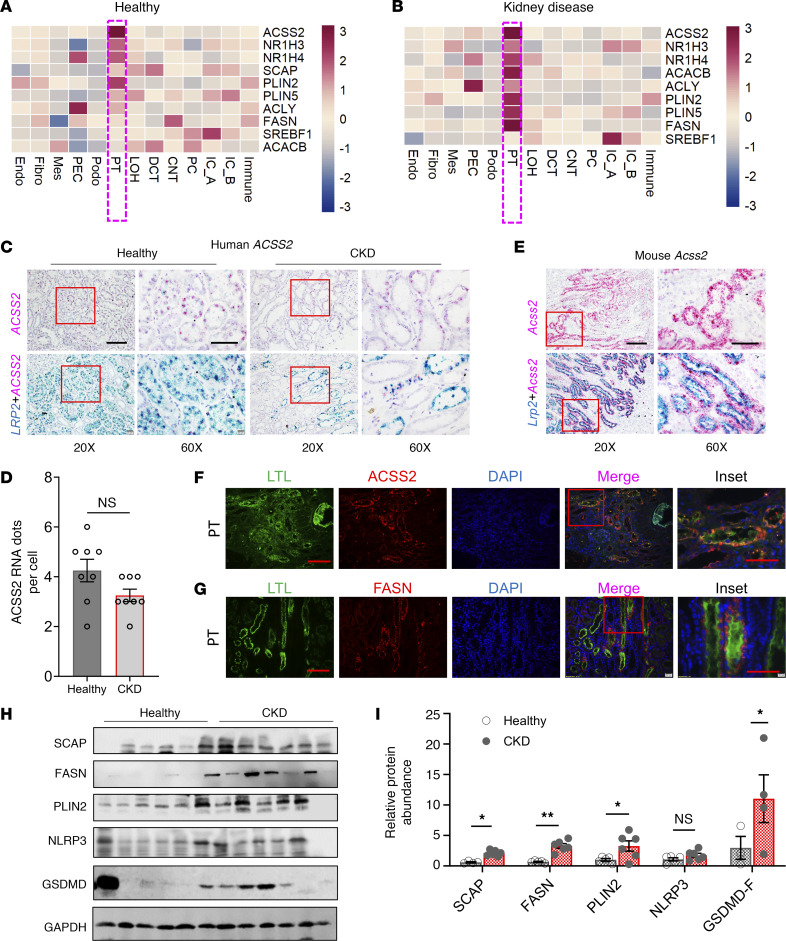
Figure 7. Changes in DNL gene expression in the kidneys of patients with CKD.
(A) Relative gene expression z scores for ACSS2, NR1H3, NR1H4, SREBF1, SCAP, PLIN2, PLIN5, ACACAB, ACLY, and FASN in healthy human kidney snRNA-Seq data. PEC, parietal epithelial cells; Mes, mesangial cells; IC_A, intercalated cells A; IC_B, intercalated cells B. (B) Gene expression z score for ACSS2, NR1H3, NR1H4, SREBF1, SCAP, PLIN2, PLIN5, ACACAB, ACLY, and FASN from human CKD kidney snRNA-Seq in various kidney cell types. (C) ISH of human ACSS2 and LRP2 in healthy and CKD human kidneys. Original magnification, ×20 (scale bar: 20 μm) and ×60 (scale bar: 10 μm). (D) Quantification of RNA ISH (n = 4). (E) ISH of mouse Acss2 and Lrp2 in healthy mouse kidney samples. Original magnification, ×20 (scale bar: 20 μm) and ×60 (scale bar: 10 μm). (F) Immunofluorescence images of ACSS2 expression in healthy human kidneys. LTL identifies the PT segment. Scale bars: 20 μm and 10 μm (inset). (G) Immunofluorescence images of FASN expression in healthy human kidneys. LTL identifies the PT segment. Scale bars: 20 μm and 10 μm (inset). (H) Immunoblots showing SCAP, FASN, PLIN2, NLRP3, and GSDMD expression in healthy and CKD kidneys (n = 6). (I) Quantification of immunoblots. Data were normalized to GAPDH and are presented as the mean ± SEM. In the healthy group, the sixth sample was excluded from statistical analysis because of its disease-like characteristics. The first sample from the healthy group was excluded from the SCAP analysis. Only 3 healthy samples and 4 CKD samples were included in the GSMD statistical analysis due to high variability. *P < 0.05 and **P < 0.01, by 1-way ANOVA after Tukey’s multiple-comparison test (D and I). The protein marker was cropped from all blots but is presented in the full blots file.

