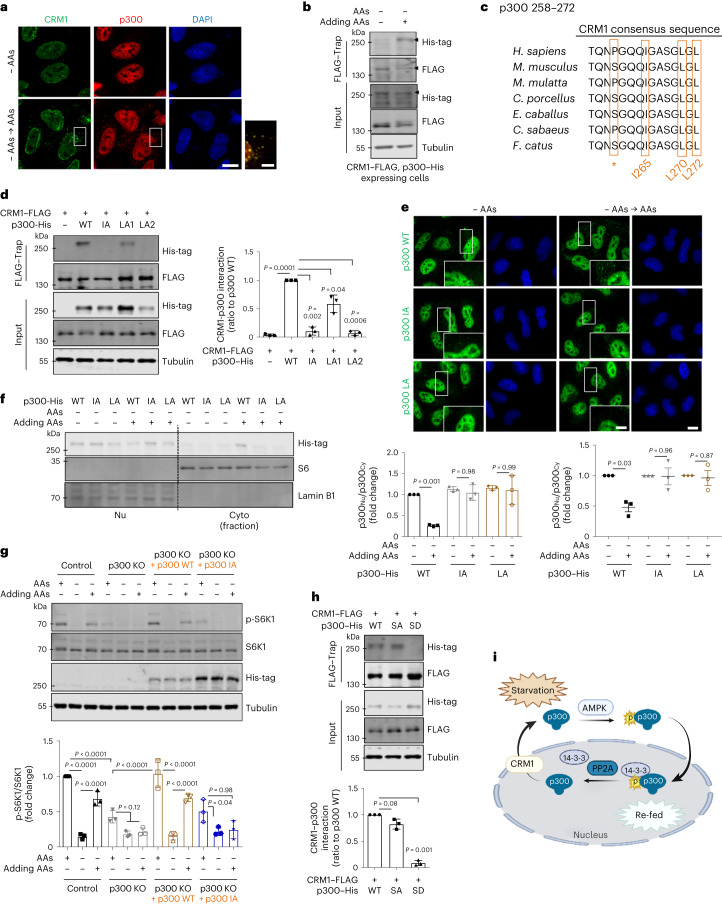
Fig. 5. p300 can be exported from nucleus in a CRM1-dependent manner.
a,b, Interaction of p300 with CRM1 when AAs were added after starvation. For immunoprecipitation, HeLa cells were cotransfected with His-tagged p300 and FLAG-tagged CRM1 (b). The expression levels following transfection were determined by using antibodies specific to the tagged protein. The images (a) and blots (b) are representative of three biologically independent experiments (N = 3). Scale bars, 5 μm and 1 μm (enlarged images). c, Cross-species sequence alignment of a CRM1 consensus sequence located in the p300 protein. Full names of species: Homo sapiens; Mus musculus; Macaca Mulatta; Cavia porcellus; Equus caballus; Chlorocebus sabaeus; Felis catus. *hydrophobic residue. d, Interaction of CRM1 with p300 mutant. For immunoprecipitation, HeLa cells were cotransfected with His-tagged p300 and FLAG-tagged CRM1. The differential expression levels following transfection are depicted by the quantification of the His-tag (N = 3). Two-tailed paired t-test. e, p300 KO HeLa cells were transfected with either His-tagged p300 WT or His-tagged NES-mutant p300 (IA and LA2) subjected to AA starvation/re-feeding and analysed by confocal microscopy for p300 localization. One sample t-test. Scale bars, 5 μm and 1 μm (enlarged images). f, Failure of cytoplasmic translocation of p300 after addition of AAs to NES-mutant p300-expressing cells (N = 3). One-way ANOVA with post hoc Tukey test. g, Inhibition of mTORC1 activity in His-tagged NES-mutant p300-expressing p300 KO cells when AAs were added after starvation. The differential expression levels following transfection are depicted by the quantification of the His-tag (N = 3). One-way ANOVA with post hoc Tukey test. h, Interaction of CRM1 with p300 SA or SD mutant. For immunoprecipitation, HeLa cells were cotransfected with His-tagged p300 and FLAG-tagged CRM1. The expression levels following transfection are determined by using antibodies specific to the tag protein (N = 3). Two-tailed paired t-test. i, A schematic diagram of the nucleus–cytoplasmic transport of p300 in response to nutrients. Data are presented as mean values ± s.d. unless otherwise specified. Source numerical data and unprocessed blots are available in the source data.

