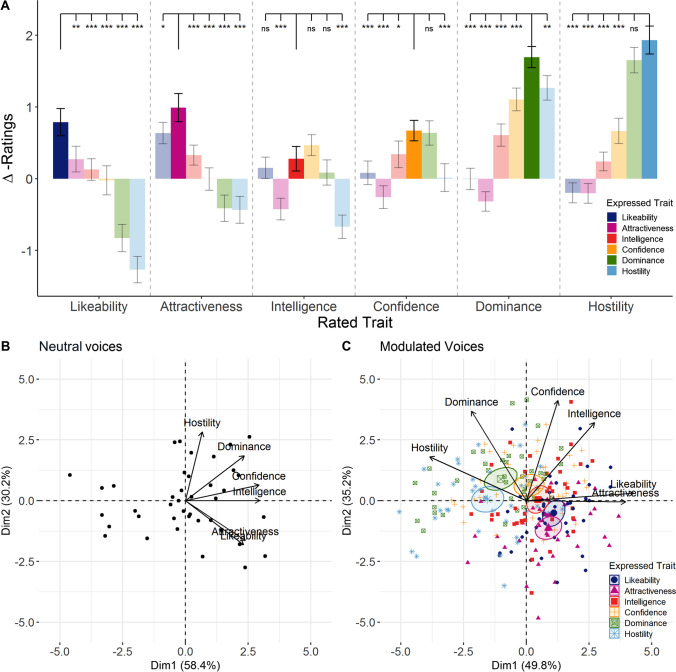
Fig. 2.
Naïve listener ratings of vocal modulations from Experiment 1. (A) Mean changes in trait ratings from neutral voices (∆-ratings) evoked by social voice modulations. Planned contrasts show differences in trait ratings over all social vocal control conditions. (B) Biplot of principal components for neutral voice recordings. (C) Biplot of principal components for ∆-ratings of modulated voice recordings. *** p < .001, ** p < .01, * p < .05. Error bars are standard errors. Ellipses represent 95% confidence intervals around the group means of expressed traits

