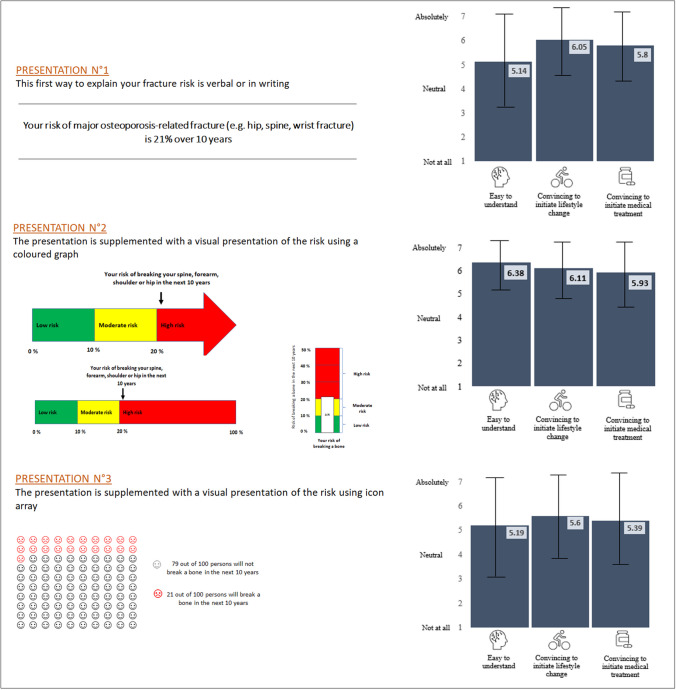
Fig. 2.
Three presentations of fracture risk. Presentation 1, written/verbal presentation of fracture risk without any visual support; presentation 2, visual presentation of the risk using a coloured traffic-light graph (three versions, horizontal with arrow, horizontal scale 0–100, and vertical); presentation 3, visual presentation of the risk using icon array. The blue bars in the graph represent the participants' ratings for each presentation (mean on a 7-point Likert scale). The black lines represent the SD around the mean. For each presentation, participants were asked to indicate their level of agreement on a Likert scale ranging from 1 (not at all) to 7 (absolutely) regarding their perception of the presentation's ease of understanding, persuasiveness for initiating lifestyle changes, and persuasiveness for initiating medical treatment

