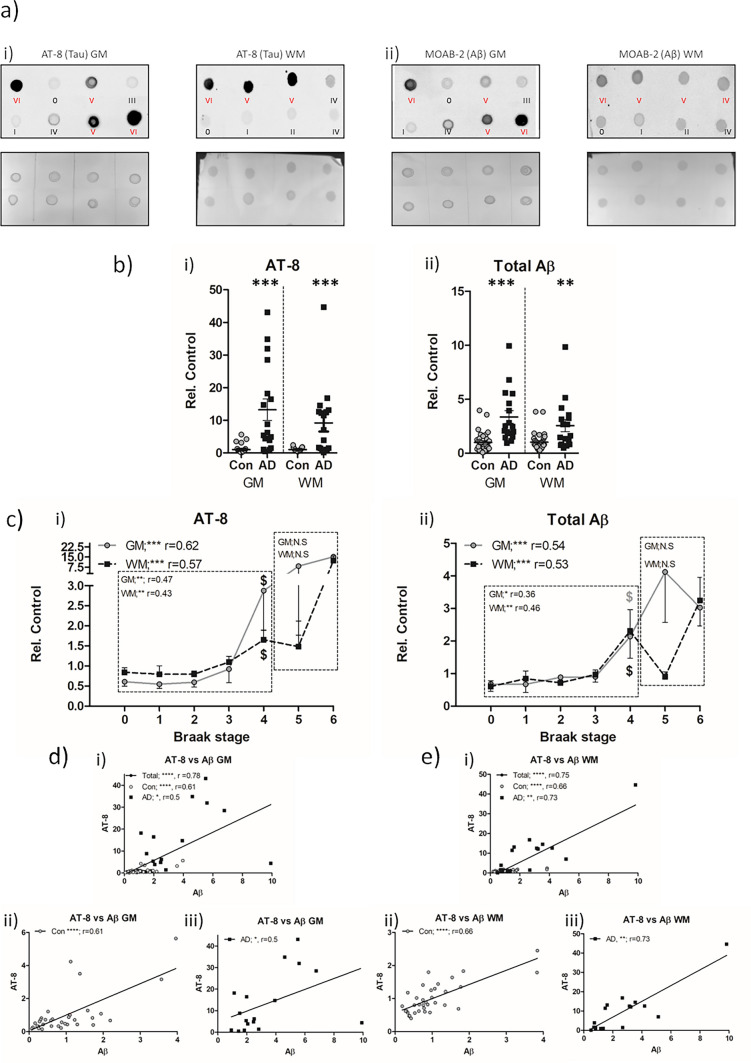
Fig. 1.
Biochemical quantification of AT-8 phospho-tau and total Aβ in the frontal cortex of non-AD and AD cases. a Example dot blots of AT-8 (i) and MOAB-2 (Aβ; ii) immunoreactivity and associated Ponceau total protein stain, produced from crude tissue lysates of frontal grey (GM) and white matter (WM) in control (Con; black lettering) and Alzheimer’s disease (AD; red lettering) cases. Braak NFT stage of each sample is shown. b Comparison of mean AT-8 (i) and Aβ (ii) immunoreactivity between Con (n = 35) and AD (n = 17) cases in the GM and WM. c Association of AT-8 (i) and Aβ (ii) immunoreactivity with Braak NFT stages across the cohort in GM and WM. Correlative analysis (Spearman’s r) is shown for when analysis as a single group or when separated into Con and AD groups. Combined (i), Con (ii) and AD (iii) linear correlations between AT-8 and Aβ in the GM (d) and WM (e). Immunoreactivity shown as relative to control (Rel. Control). * = p < 0.05, ** = p < 0.01, *** = p < 0.001 and **** = p < 0.0001. $ denotes initial Braak NFT stage at which immunoreactivity is significantly elevated from Braak 0 controls

