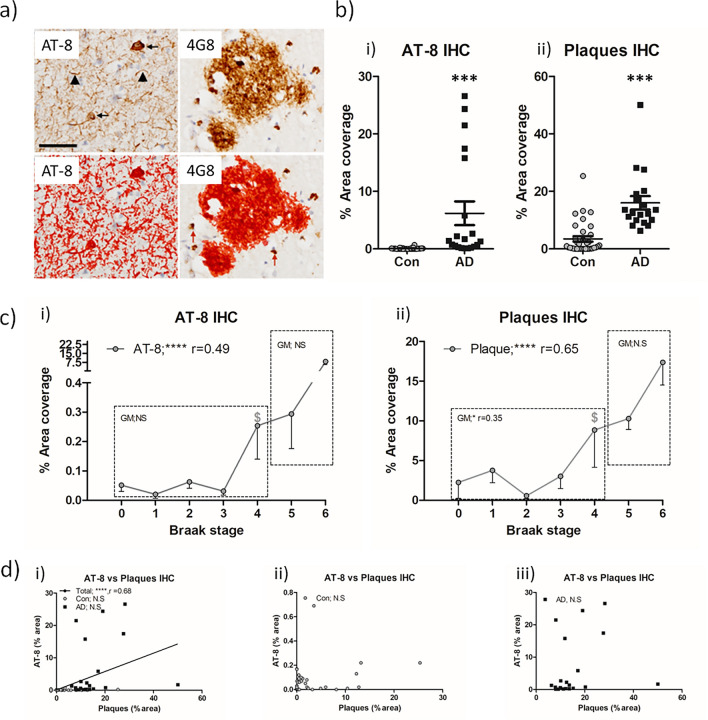
Fig. 2.
Immunohistochemical quantification of AT-8 tau and Aβ plaque burden in the frontal cortex of non-AD and AD cases. a Example micrographs of DAB based AT-8 and 4G8 (Aβ) immunoreactivity, area of quantification following threshold application shown in red. Note the size exclusion in this parameter of intracellular 4G8 labelling to negate potential APP cross-reactivity (arrows). b Quantification of % area coverage of AT-8 (i) and plaque (ii) immunoreactivity in control (Con, n = 36) and Alzheimer’s disease (AD, n = 20) cases. c Association of % area coverage of AT-8 (i) and plaques (ii) with Braak NFT stage with correlative analysis (Spearman’s r) shown. Combined (i), Con (ii) and AD (iii), linear correlations between AT-8 and plaques in the GM (D). N.S. = not significant, *** = p < 0.001 and **** = p < 0.0001. $ denotes initial Braak NFT stage at which immunoreactivity is significantly elevated from Braak 0 controls. Scale in a = 20 µm

