Fig. 4.
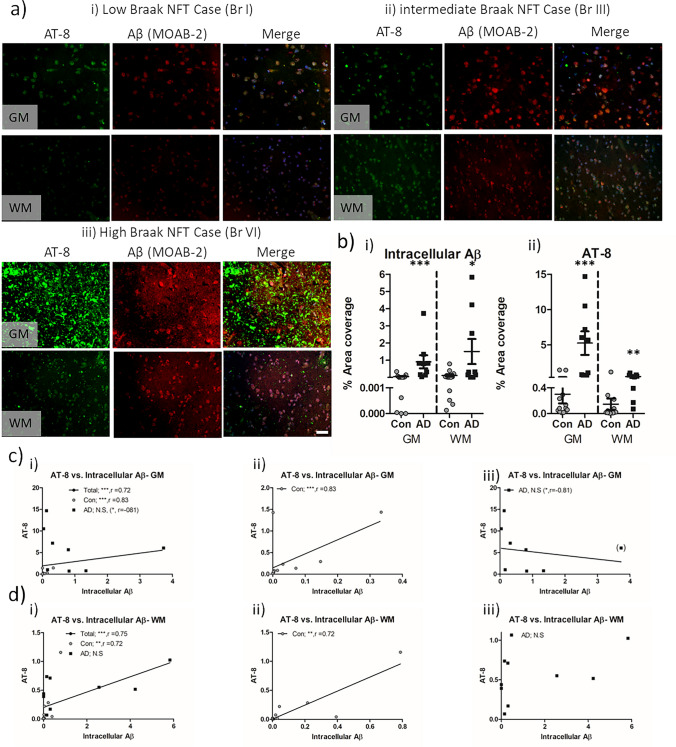
Immunohistochemical quantification of intracellular Aβ and AT-8 tau in the frontal cortex of non-AD and AD cases. a Example micrographs of AT-8 phosphorylated tau and MOAB-2 labelled intracellular Aβ in GM and WM of low (i), intermediate (ii), and high (iii) Braak stage cases. b Quantification of intracellular Aβ (i) and AT-8 phospho-tau (ii) expressed as percentage area coverage in control (Con, n = 13) and Alzheimer’s disease (AD, n = 9) cases. Combined (i), Con (ii) and AD (iii), spearman’s correlations (r) between AT-8 and plaques in the GM (c) and WM (d). Note for the identification of a statistical outlier in c, the data point is bracketed and subsequent analysis within correlation excluding the case is reported within brackets. N.S. = not significant, * = p < 0.05, ** = p < 0.01, *** = p < 0.001 and **** = p < 0.0001. Scale = 20 µm

