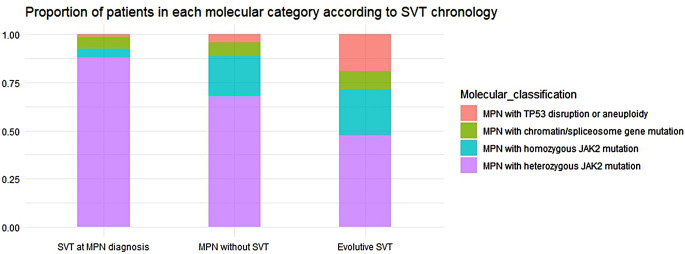
Fig. 2.
Proportion of patients in each molecular category according to SVT chronology. The bar plot shows the difference on the proportion of patients in each molecular category according to SVT chronology. MPN presenting with SVT group showed a low proportion of cases in high-risk categories (1.7% TP53 disruption or aneuploidy, 3.4% chromatin/spliceosome gene mutation and 5.1% homozygous JAK2 mutation) and a very high proportion of patients falling into heterozygous JAK2 mutation category. The proportions differed from those in MPN without SVT (4.2% TP53 disruption or aneuploidy, 6.1% chromatin/spliceosome gene mutation, 20.6% homozygous JAK2 mutation and 69.1% homozygous JAK2 mutation) and those in MPN with evolutive SVT (19% TP53 disruption or aneuploidy, 9.5% chromatin/spliceosome gene mutation, 23.8% homozygous JAK2 mutation and 47.6% heterozygous JAK2 mutation). The differences seen on the proportion of patients in each category were statistically significant (p = 0.006). Abbreviation: MPN, Myeloproliferative neoplasm; SVT, Splanchnic vein thrombosis

