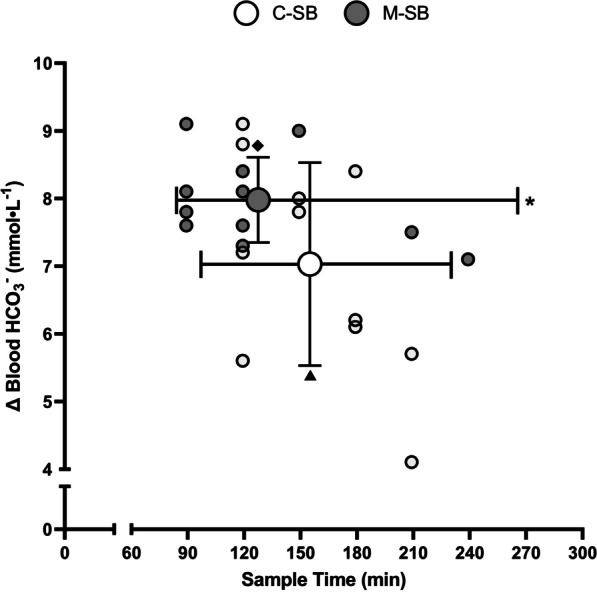
Fig. 2.

Blood bicarbonate change responses (Cmax) following sodium bicarbonate ingestion in capsules (C-SB) and the bicarb delivery system (M-SB). Large dots represent mean responses with vertical error bars representing ± SD. Horizontal error bars represent the mean duration of blood bicarbonate being > 5 mmol⋅L−1. (♦) denotes a significantly higher Cmax (p < 0.05). (*) denotes a significantly longer period of time at blood bicarbonate concentrations > 5 mmol⋅L−1 (p < 0.05). (▲) denotes a significantly longer time to peak blood bicarbonate concentration (p < 0.05)
