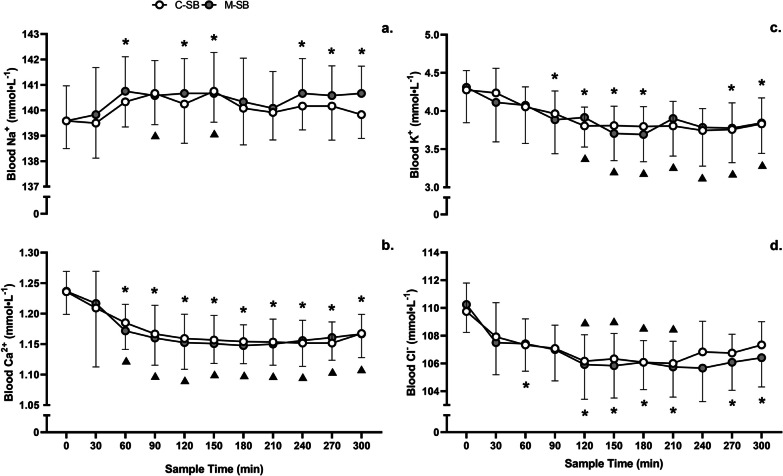
Fig. 3.
Mean (± SD) blood sodium (Na+) [a], calcium (Ca2+) [b], and potassium (K+) [c] and chloride (Cl−) [d] responses to sodium bicarbonate ingestion in capsules (C-SB) and the bicarb delivery system (M-SB). (*) denotes a significant difference in the blood concentration from the pre-ingestion sample time for M-SB (p < 0.05). (▲) denotes a significant difference in the blood concentration from the pre-ingestion sample time for C-SB (p < 0.05)

