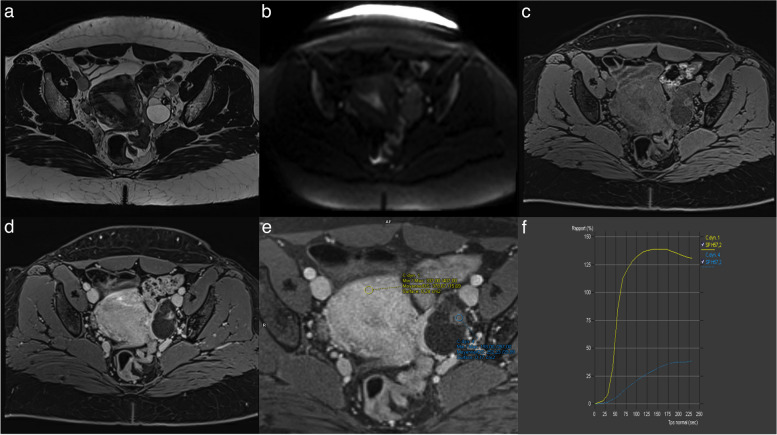
Fig. 14.
Example of left ovarian lesion with a solid component with a type I dynamic enhancement curve. a Axial T2-weighted sequence without fat saturation. b Axial DWI scan (b: 1200 s/mm2). c Axial unenhanced T1-weighted water sequence. d Axial late-gadolinium T1-weighted sequence. e, f DCE MRI T1-weighted sequence with corresponding curve of the tissular component showing a type I curve. This was favored to be a benign cystadenofibroma

