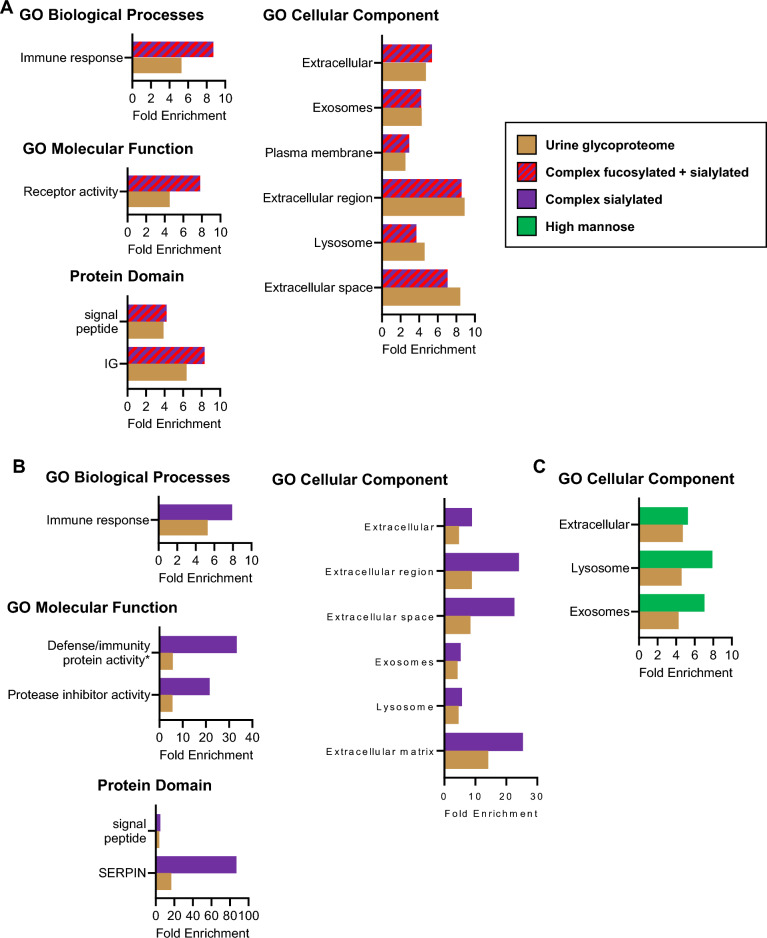
Figure 4.
Gene enrichment analysis of glycoproteins with dominant (A) complex fucosylated and sialylated glycans, (B) complex sialylated glycans, and (C) high mannose glycans, compared to the overall urine glycoproteome. All gene sets are significant (Bonferroni-corrected p < 0.01 in the urine glycoproteome and urine sub-glycoproteome) unless otherwise noted. The top most significant gene sets in each urine subglycoproteome are shown. *Not significant in the urine glycoproteome.

